Market Commentary | April 2020
THE MARKET
The COVID-19 pandemic stunned the stock market in March, but it rebounded nicely in April.
The S&P 500 experienced its best month since 1987 as it finished April up 12.7% and it is now down 9.9% for the year.1 The Dow Jones Industrial Average was up 11.1% in April and is now down 14.7% on the year. The NASDAQ Composite finished April up 15.5% and is down just under 1% on the year.2 As the public and the markets continue to get more comfortable with our current situation, volatility began to come down from its peak levels. The standard volatility index, the VIX, went from over 80 at one point in March down to just over 34 to end April. The trailing 12-month average of the VIX sits just over 21, and we expect volatility to continue in the near term.2 Small Cap stocks led the equity markets in April as they were up 13.5%, but they are still significantly down for the year at negative 20.5%.
Today’s stock market will continue to be event driven with continued uncertainty surrounding the impacts of the virus. The strong monthly performance numbers came alongside a deterioration in earnings expectations. As a result, equities are seen as fairly expensive again. With a surge in fixed income buying combined with global easing in monetary policy, yields are being pushed to record lows. Because of this, it is important to focus on quality when it comes to investing in both equities and fixed income. Long term, equities are still at a discount relative to their February highs, and traditional fixed income is not providing the yields that many have become accustomed to receiving. However, it is important to have exposure to quality fixed income such as treasuries and higher quality corporate bonds for protection in your portfolio. It is too late to become overly defensive, and too premature to become overly aggressive. It is important to have a quality balanced and diversified portfolio based on your risk tolerance.
THE ECONOMY
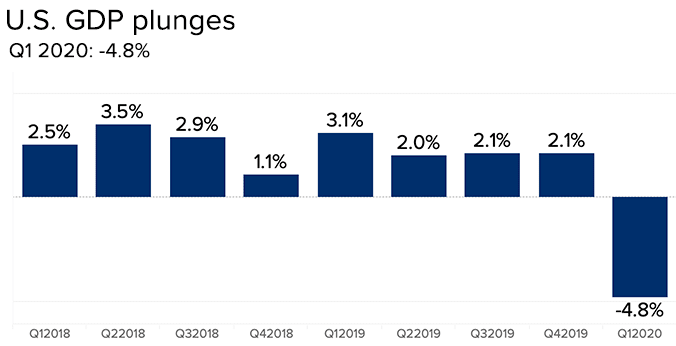
While the market experienced its best month since 1987, the economy suffered its first quarterly drop in GDP since 2014 and its largest drop since 2008. First quarter United States GDP was down 4.8% in annualized terms (1.2% in absolute terms).4 This is just the tip of the iceberg as that number includes January, February, and the first half of March which were all okay numbers before the roof caved in the second half of March. Second quarter GDP numbers are predicted to be negative 25% or more on an annualized basis (6.25% or more in absolute terms).5 That is between a 7-8% drop in GDP in absolute terms during the first two quarters of 2020. To put that into perspective, the absolute decline in GDP during the Great Financial Crisis of 2007-2009 was 4.3%.6 The unemployment rate will likely continue to rise and is projected to average close to 14% in the second quarter.7 This is clear evidence that we are officially in the thick of a recession. A recession is defined as two consecutive quarters of negative economic growth as measured by a country’s gross domestic product (GDP) in conjunction with other monthly indicators such as rising unemployment.
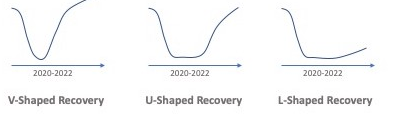
The first part of this recession is now shaped, and it was quite the plunge. Does the second part of the recession result in a V shape, a U shape, or something resembling the swoosh of a Nike logo? The recent market performance in the month of April indicates the thought of a V-shaped recovery, but we do think the market may be too optimistic in visualizing a V as we believe a U-shaped recovery is more likely. The timing and formation of the shape is likely a function of the disease. It seems more and more likely that we will end social distancing protocols too aggressively or prematurely and it is also possible that we could see a resurgence of the virus later in the year which will not be a good sign for the economy. We aren’t in the business of speculating the dates of reopening of the economy, but it is likely to come in stages with the final stage occurring after a vaccine.
We are currently in The Great Lockdown as coined by the IMF which has led to the worst economic downturn since the Great Depression.8 This is the phase where many of us are under quarantine and experiencing stay at home orders. We are slowly starting to enter the next phase where things begin to reopen gradually and some stay at home orders have been lifted. However, it is not about what the government allows businesses to do, but it is about what the public will do. Will they go to restaurants with the threat of the virus still looming? Some will, but others are not going to want to be served by someone with a facemask on. Will the public travel for business or vacation? Some will, but imagine how uneasy the cabin of an airplane will be when one passenger sneezes a few times. The point is people will still be cautious. We have to look at things that can be done with a bit of social distancing. We can still buy a house and keep our distance from the realtor. We can still buy a car and keep our distance from the salesperson. We can open factories with social distancing measures in place and even some office buildings. But it is highly unlikely that your city’s restaurant and bar scene will be full steam ahead. We probably aren’t going to have large gatherings for concerts and sporting events. We will start to adapt to a social distancing economy as we begin to enter the next phase. A phase of healing. A phase hallmarked by providing better treatments and have better protocols in place to deal with the virus. Eventually we will have a tested and distributable vaccine that will take weeks or possibly months to fully implement. And finally, we will enter the post virus phase hopefully sometime in 2021 that will allow the economy to begin roaring back.
This will be an unusual economic recession and an unusual recovery. But this recession is different from most others in how quickly we realized that we are in one. It often takes some time. We didn’t realize that we were in the Great Financial Crisis of 2007-2009 until the second half of 2008. We also know what caused our current recession. Short answer, the virus. We do not have to speculate about other causes. And we have a good idea of what the other side of this recession will look like. We believe that there will be jobs waiting for many of the unemployed and that the economy will come back strong after fears regarding the virus have subsided. We just don’t know how long we will hover at the bottom before we come out on the right side. We don’t know if the virus will come back surging after we relax social distancing measures. We don’t know if the summer heat will hinder the virus. And we don’t know when a vaccine will be widely distributable. These questions all lead to uncertainty in the length of this economic recession.
UNCERTAINTY
The market does not like uncertainty. It doesn’t mind negative news with visibility because at least it is certain, but there is complete uncertainty in the market right now, and we do believe that the market has gotten ahead of itself. It might not retest the lows experienced in March, but it is too optimistic of a V-shaped recovery at this point. We are likely looking at a U-shaped recovery, especially if we do see a surge in cases as social distancing measures are relaxed.
There is no denying that April’s market performance was tremendous, however, it came during a contraction of earnings expectations for most companies. When looking at the market from a valuation standpoint, stocks are quite expensive. The S&P 500 forward price-to-earnings ratios are at levels similar to the dotcom bubble in 2000-2001.10 There is room for another pullback at some point this year.
The market rally in late March and April was in large part due to the stimulus from the CARES Act. There was a liquidity issue in the market, and the Fed replenished that liquidity. The Fed is building a bridge. It is writing off the second quarter and looking to the other side of the bridge in the third or fourth quarter when traditional economic fundamentals can start to kick back in and influence the market. However, we don’t know if the bridge is strong enough or if it will be long enough. This uncertainty and lack of visibility is creating the volatility. It is unlikely that we head into a runaway bull market this summer while millions of people are not working and while we are losing money in terms of GDP.
As we’ve previously discussed, the first large market decline during the Great Financial Crisis of 2007-2009 occurred in October of 2008. We then experienced some government stimulus and the market rallied before hitting its bottom in January of 2009.11 Something similar is possible again. A bear market rally is a sharp increase in price amid a bear market. Simply put, it is a short-term revival in the middle of a broader bear market. There has been debate regarding the current rally and whether it is a bear market rally that will retract again at some point. The S&P 500 rallied 30% from its low on March 23rd through the end of April.2 The average bear market rally is just under 25% before the market goes on to hit new lows shortly after. Since the end of 1927, the S&P 500 has experienced 14 bear runs (when the index closes 20% below a record peak). Within those periods, the index rallied over 15% on twenty separate occasions before pullbacks with those rallies averaging around 78 days each.12 The image to the right highlights four recent recessions and the bear market rallies within them.
But this does not mean it is time to panic. We may not go through the low that occurred on March 23rd of 2020, but we may experience another pullback before the economic fundamentals kick in and we establish a firmer market bottom and trajectory of growth. We simply do not know what will happen nor should we try to predict or call the bottom. The monetary and fiscal responses that happened so rapidly don’t have a comparison. We don’t know if the current bridge built by the Fed will suffice, and the uncertainty remains around the Fed having to provide another stimulus package later this year. The Fed did stand pat in its most recent Federal Open Market Committee meeting in late April as it kept the target rate at 0.00% - 0.25% and essentially reiterated the fact that it is ready and willing to do whatever it takes to keep the economy afloat.14
CONCLUSION
This will be a brutal recession that causes a great deal of harm, but from the equity market standpoint, it is a short-term event and we need to keep our focus on the long-term picture of our financial plan. Whether the market is truly on a path of recovery or we are set to drop 600 points this quarter, the market is still looking at an upside of over 16% to get back to where it was in February.2 The United States stock market has never failed to recoup a prior high and we are confident that this time is no different. We believe that eventually it will come back fully. If it takes a year, that is an annualized return of over 16%. If it takes two years, that is still nearly a double-digit annualized return. Regardless of what happened in April, there is still a lot that this market can do. Rather than looking at the next few months through a short-term lens, look at the big picture and the opportunity that the next 12-18 months can bring.
After the market pull back this year, it is likely that your portfolio has deviated from its initial asset allocation. If you would like to discuss your portfolio’s allocation or revisit your risk tolerance, don’t hesitate to reach out.
2 https://www.investing.com/indices/major-indices
4 https://www.cnbc.com/2020/04/29/us-gdp-q1-2020-first-reading.html
6 https://www.federalreservehistory.org/essays/great_recession_of_200709
7 https://www.cbo.gov/publication/56335
9 https://medium.com/@kleiner.art/the-case-for-rebound-optimism-ca72b1a5664c
10 https://www.ft.com/content/26b4b77b-81c8-4cbb-a7ee-217b1d71e0dc
11https://en.wikipedia.org/wiki/United_States_bear_market_of_2007%E2%80%932009
13 https://seekingalpha.com/article/4335484-anatomy-of-bear-market-rally
14https://www.federalreserve.gov/monetarypolicy/files/monetary20200429a1.pdf
Returns are based on the S&P 500 Total Return Index, an unmanaged, capitalization-weighted index that measures the performance of 500 large capitalization domestic stocks representing all major industries. Indices do not include fees or operating expenses and are not available for actual investment. The hypothetical performance calculations are shown for illustrative purposes only and are not meant to be representative of actual results while investing over the time periods shown. The hypothetical performance calculations for the respective strategies are shown gross of fees. If fees were included returns would be lower. Hypothetical performance returns reflect the reinvestment of all dividends. The hypothetical performance results have certain inherent limitations. Unlike an actual performance record, they do not reflect actual trading, liquidity constraints, fees and other costs. Also, since the trades have not actually been executed, the results may have under- or overcompensated for the impact of certain market factors such as lack of liquidity. Simulated trading programs in general are also subject to the fact that they are designed with the benefit of hindsight. Returns will fluctuate and an investment upon redemption may be worth more or less than its original value. Past performance is not indicative of future returns. An individual cannot invest directly in an index.
This material has been prepared for information and educational purposes and should not be construed as a solicitation for the purchase or sell of any investment. The content is developed from sources believed to be reliable. This information is not intended to be investment, legal or tax advice. Investing involves risk, including the loss of principal. No investment strategy can guarantee a profit or protect against loss in a period of declining values. Investment advisory services offered by duly registered individuals on behalf of ChangePath, LLC a Registered Investment Adviser.

Source (3)
Source (4)

Source (8)
"We didn’t realize that we were in the Great Financial Crisis of 2007-2009 until the second half of 2008."
Source (9)

Source (13)
"Rather than looking at the next few months through a short-term lens, look at the big picture and the opportunity that the next 12-18 months can bring.
"


P:
888.798.2360 F:
913.661.1183
6330 Sprint Pkwy Suite 400, Overland Park, KS 66211
Disclosure: Continuity planning offered through CreativeOne Wealth, LLC and CreativeOne Securities, LLC. CreativeOne Wealth, LLC. advisory services offered through CreativeOne Wealth, LLC, a Registered Investment Adviser. CreativeOne Securities, LLC. Member FINRA/SIPC and an Investment Advisor.
Privacy Policy | ADV Part 2A | Form CRS
© 2023 Creative One Marketing Corporation, CreativeOne Wealth, LLC and CreativeOne Securities, LLC.