Market Commentary | October 2021
October was another positive month for the markets after September’s pullback. So far in 2021, the S&P 500 had nine positive performing months, September being the only hold out. The index ended up 6.9%, even though the first week of the month started a bit volatile. However, 2021 is looking robust, even if November and December aren’t large contributors, as the YTD performance through October is 23.9%.1
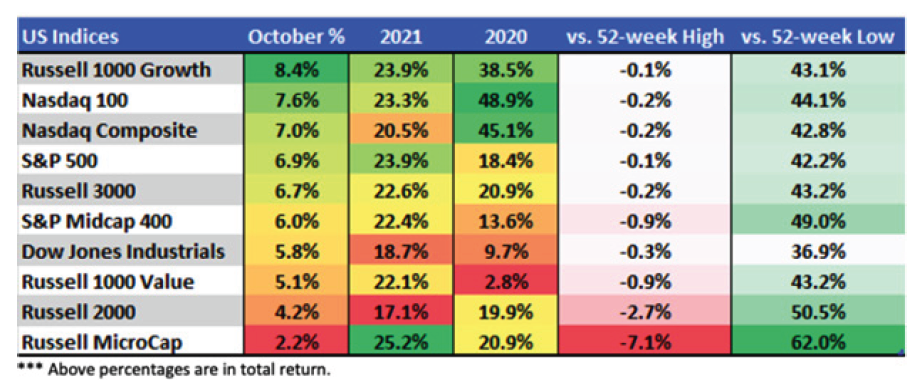
The Dow Jones Industrial Average (DJIA) was also up 5.8% for the month and 18.7% for the year. The NASDAQ Composite was up 7.6% for the month and 20% for the year. Performance of small cap stocks continued to trail large cap stocks and remain positive. The small cap index was up 4.2% for the month and 17.1% for the year after a strong start.

Similar to U.S. Equities, International Equities did well during October with performance over 5%.2 Emerging Market Equities lagged the pack with a measly performance of just below 1%.
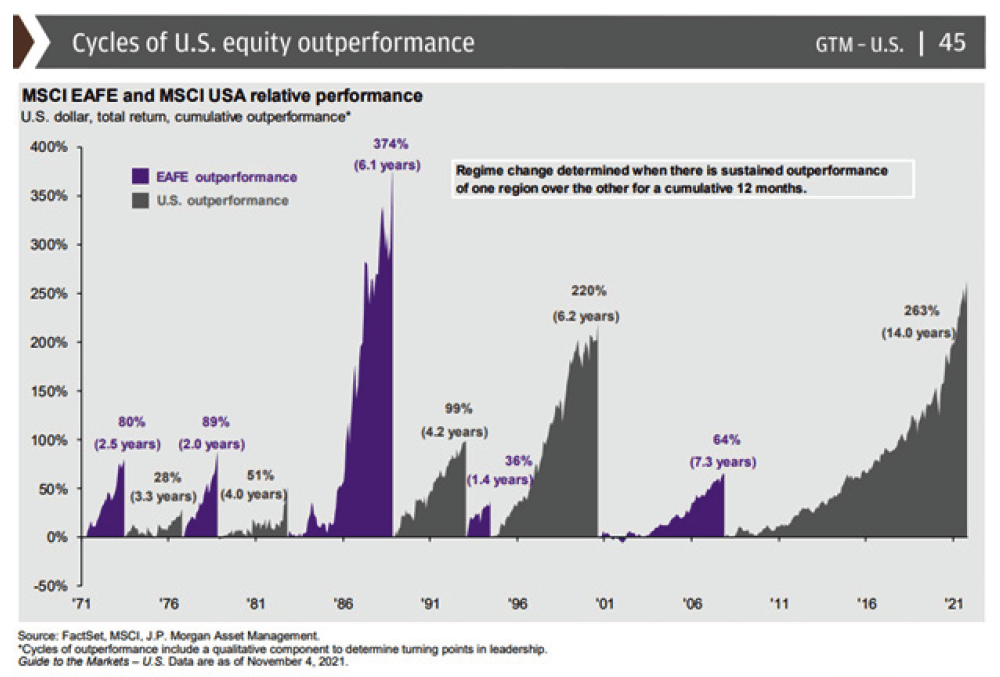
This trend of U.S. Equities dominating International is a decades-old story and appears to continue the trend into the near future.3
THE VIRUS
It’s been just under two years since the world was introduced to COVID-19 and it remains an important market driver. While the Delta variant was a big cause for concern during summer, reopening businesses are on the upswing. The large rollout of vaccines both domestically and globally have helped the upswing. Below is a graph of the United States’ progress toward immunity.4

On November 2, the Center for Disease Control announced Pfizer’s children’s vaccine was approved.5 With additional vaccines for children age 5-12, immunity population will soon increase. As vaccines roll out, it’s positive news for the markets.
THE ECONOMY
Real GDP in the United States increased 2%, and an annual rate in the third quarter of 2021 according to the advance estimate released by the Bureau of Economic Analysis. These figures are down from the second quarter increase of 6.7%.6

According to the Bureau of Economic Analysis, the GDP increase was driven by private inventory investment, personal consumption expenditures (PCE), state and local government spending and nonresidential fixed investments. These increases were offset partially by decreases in residential fixed investment, federal government spending and exports. Additionally, imports, a subtraction from the GDP calculation increased.
Looking at the positive contributors for GDP, the increase in private inventory investment was led by the non-durable goods industry, reflecting increases in wholesale trade and in retail trade, including motor vehicles and parts dealers. The increase in Personal Consumption Expenditure (PCE) was mostly due to an increase in services, which were somewhat offset by a decrease in goods. Contributions in services were generally widespread with the largest contributions coming from “other” services (mainly international travel), transportation services, and health care. Increased spending by state and local governments was led by employee compensation, most notably in education. Intellectual property products (such as software) led the increase in nonresidential fixed, which was only partly offset by a drop in structures and equipment.
A decrease in residential fixed-investments, decreases in improvements and in new single-family structures negatively impacted the GDC. Non-defense spending on intermediate goods and services declined and thus, reflected the federal government spending. The decrease in exports also reflected a slight increase in services, but not enough to offset goods. The increase in imports was led by travel and transport services. Also during the third quarter, the GDP decelerated based on the slowdown in PCE.
INFLATION
Inflation has been a big talking point for many financial pundits in recent months. Inflation is nearly at its highest level in 30 years.7
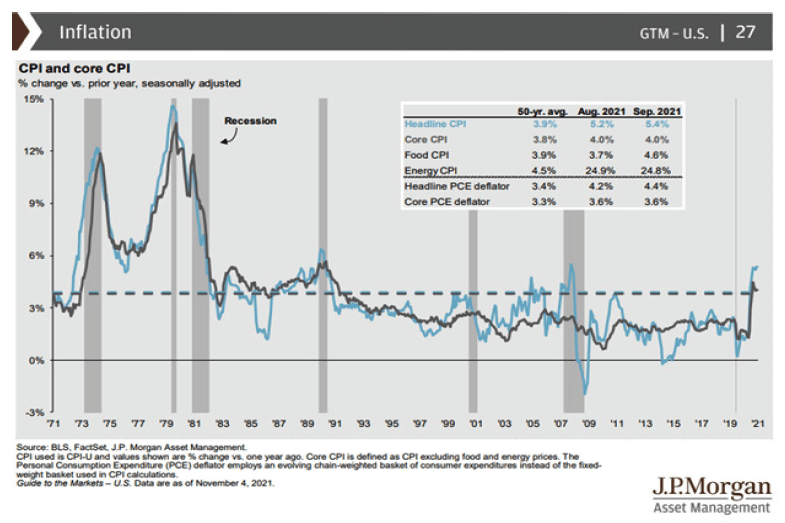
Several factors are driving inflation upward, including short-term factors like supply-chain constraints and record consumer-saving behavior. Additionally, some intermediate-term factors like dramatic price increases in housing and rent, rising wages, and rising energy costs are notable. These short to intermediate term factors may be dampened in the future by longer term factors such as technology increases, globalization and an aging demographic.
In the interim, inflation is looking to impact this year’s Thanksgiving dinner. At the center of many holiday meals is turkey! The cost is expected to exceed the 2015 benchmark set by the Department of Agriculture which was $1.36 per pound. The 2021 cost will exceed that benchmark by at least $.25 per pound.8
Increasing inflation is going to create a balancing act for the Federal Reserve. On one hand the Fed still feels the U.S. economy needs assistance, as it has yet to recover roughly five million lost jobs during the pandemic. On the other hand, inflation is increasing steadily as Americans continuing to spend despite widespread shortages. The Fed will continue to struggle with this balancing act for the near term. During their November 3 meeting, the Fed left interest near zero as part of a long-term strategy to fuel employment.9
In addition to keeping rates low, the Fed announced a plan to start tapering the bond purchase program. The program was designed so the Fed could purchase $120 billion worth of bonds each month beginning mid-2022. This policy should combat inflation, because the bond market dictates the cost of borrowing, especially for home and automobile loans. With the Fed bond purchases, rates can remain low for consumers.
Some investors have shifted portfolios into equities to combat inflation and potentially insulate portfolios against future missteps by the Fed. Other investors have begun to explore fixed-income alternatives including high-yield and emerging markets bonds.
CONCLUSION
The equity markets and inflation are on fire right now and there are no guarantees that either will stay the course. Looking into 2022, the term structure of the Volatility Index is in contango, meaning the future price of volatility is higher than the spot price.10
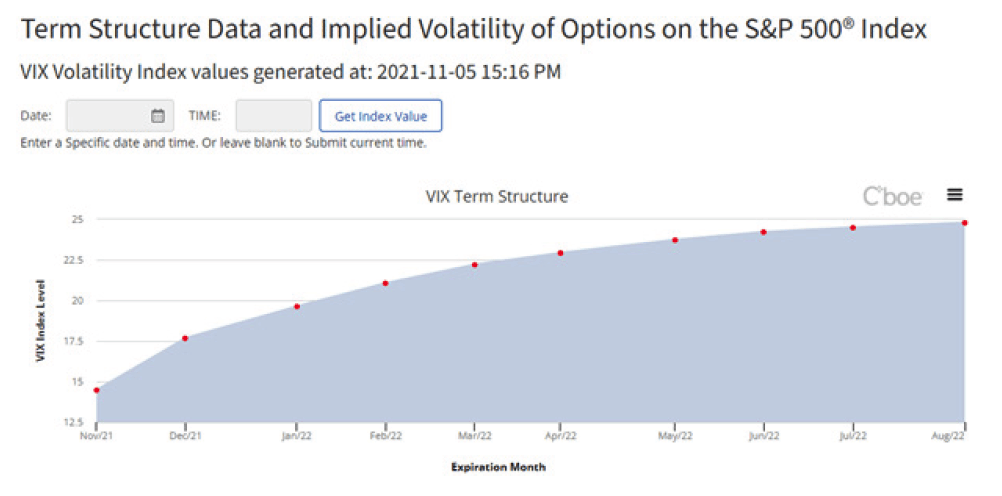
According to this graph, the futures market volatility is set to rise during the early months of 2022. If market volatility has not been a part of conversations surrounding investing and portfolios, it’s a good time to start a dialogue.
The current structure of the VIX future leads the outlook to be bullish, albeit cautious. There is potential for growth, but now is the time to be selective in the portfolio allocation. Moving more heavily into U.S. Large Cap, Government Bond and Growth Stocks can help insulate against volatility. Also, reducing exposure to Sector bets and Emerging Markets Stocks can possibly help reduce turbulence in portfolios.
The market is volatile, but history has shown disciplined investment approaches can be superior. The market could continue to fall until the close of year, but it might not. In the end, investing is about time in the market, not about timing the market. We continue to recommend a globally diversified approach based on an individual’s risk tolerance. If you’d like to revisit your risk tolerance or talk about how the recent pull back in the market has made you feel, please don’t hesitate to reach out and schedule a conversation.
1 https://www.nasdaq.com/articles/october-2021-review-and-outlook-2021-11-01
2 https://www.msci.com/documents/10199/c0db0a48-01f2-4ba9-ad01-226fd5678111
6 https://www.bea.gov/sites/default/files/2021-10/gdp3q21_adv.pdf
8 https://www.nytimes.com/2021/10/25/dining/thanksgiving-inflation-supply-chain-food-costs.html
9 https://www.npr.org/2021/11/03/1051478945/federal-reserve-inflation-jobs-employment
10 https://www.cboe.com/tradable_products/vix/term_structure/
This commentary is published by ChangePath, LLC and is provided free of charge for information and education purposes and should not be construed as a solicitation for the sale or an offer to buy any security. This information is not intended to be investment, legal or tax advice. The information presented was obtained from sources and data considered to be reliable, but its accuracy and completeness is not guaranteed. It should not be used as a primary basis for making investment decisions. Any stated or implied recommendations herein are of a general nature. Clients should consult with their investment advisor representative for advice concerning their particular situations and consider their own financial circumstances and goals carefully before investing. This commentary is designed to be general in nature and reflects our overall opinion. Certain sections of this commentary contain forward-looking statements that are based on our reasonable expectations, estimates, projections, and assumptions. Forward-looking statements are not indicators or guarantees of future performance and involve certain risks and uncertainties, which are difficult to predict. Opinions, beliefs and/or thoughts are as of the date given and are subject to change without notice. Past performance is not indicative of future returns and there is always a risk of loss of principal with any investment strategy. Individuals cannot invest directly in an Index. Indices are unmanaged and do not reflect actual portfolios or trading and the stated returns do not include investment management fees, transaction fees, dividends and other earnings and the timing of investment decisions, thus, they are not necessarily indicative of the allocation or return that an actual managed account in the future will or would have achieved. Investment advisory services offered by duly registered individuals on behalf of ChangePath, LLC a Registered Investment Adviser.


P:
888.798.2360 F:
913.661.1183
6330 Sprint Pkwy Suite 400, Overland Park, KS 66211
Disclosure: Continuity planning offered through CreativeOne Wealth, LLC and CreativeOne Securities, LLC. CreativeOne Wealth, LLC. advisory services offered through CreativeOne Wealth, LLC, a Registered Investment Adviser. CreativeOne Securities, LLC. Member FINRA/SIPC and an Investment Advisor.
Privacy Policy | ADV Part 2A | Form CRS
© 2023 Creative One Marketing Corporation, CreativeOne Wealth, LLC and CreativeOne Securities, LLC.