Market Commentary | July 2021
THE MARKET
The S&P 500 continued to climb for the fifth straight month as the index hit a new all-time high on July 29th.1 The index finished the month up 2.27% and is now up 17.02% on the year. The Dow Jones Industrial Average (DJIA) and the NASDAQ Composite both increased during the month as well finishing up 1.26% and 1.20% respectively. Both indices are now comfortably in double digit returns for the year. Small cap stocks took a significant hit as the Russell 2000 fell 3.65% during the month, but it is still up 12.73% on the year. As investors move some of their equity gains into fixed income and the Fed continues with their asset purchases, bond demand has increased leading to a return of 1.12% for the U.S. Agg in the month of July. It is now down just 0.50% on the year.2
| Index Returns (as of 7/30/2021) | Level | July/QTD | YTD |
|---|---|---|---|
| S&P 500 | 4,395.26 | 2.27% | 17.02% |
| Dow Jones Industrial Average | 34,936.13 | 1.26% | 14.15% |
| NASDAQ Composite | 14,672.70 | 1.20% | 13.80% |
| Russell 2000 | 2,226.25 | -3.65% | 12.73% |
| MSCI EAFE | 2,321.09 | 0.70% | 8.08% |
| MSCI Emerging Markets | 1,277.80 | -7.04% | -1.04% |
| U.S. Aggregate Bond | - | 1.12% | -0.50% |
Source (2)
International equities were relatively flat as the MSCI EAFE Index (Europe, Australasia, Far East) was up 0.70% for the month and is now up just over 8% on the year. However, the Delta Variant is causing real problems in those countries with less access to the vaccine as the MSCI Emerging Markets index fell over 7% during the month of July and it is now down over 1% on the year.2
THE DELTA VARIANT
The vaccine rollout continued its progress through July as more states began to ease economic restrictions. However, this progress has hit a bump in the road as the more contagious Delta variant of the virus begins to spread. The economic reopening of the country is still well on its way, but it might take longer than expected as some local governments are beginning to tighten restrictions, specifically regarding mask mandates. As of July 31st, the seven-day moving average is 72,000 COVID-19 cases per day, 6,200 hospital admissions per day, and 300 deaths per day, according to data from the Centers for Disease Control and Prevention (CDC). These numbers have each increased by over 25% week-over-week. Initial research found that breakthrough infections (vaccinated individuals getting the virus) occurred at rates of 2% or less, however, the CDC published data on Friday, July 31st, that found 74% of 469 infections in an outbreak in the Cape Cod and Provincetown region were in people who were vaccinated.3

Source (4)
Source (5)
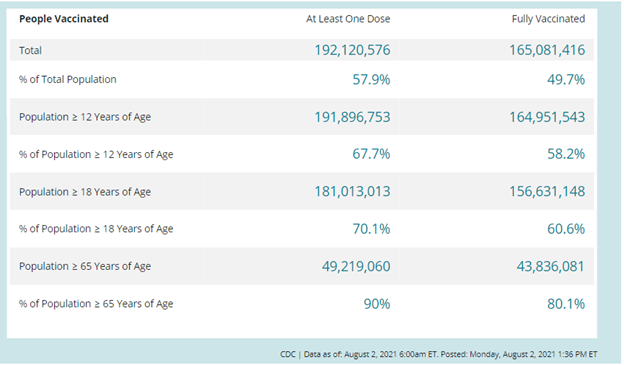
On a positive note, the overall national vaccination rate is increasing. More than 3 million Americans have received a first shot of a COVID-19 vaccine in the past seven days. As of August 2nd, at least 49.7% of people in the U.S. have now been fully vaccinated, and 70.0% of those over 18 years of age have received one shot, according to the CDC.3 There is still more research to be done, and regardless of your opinion, this is something that health officials and governments will be taking seriously for the foreseeable future. We do not believe that this will hinder economic growth the way that the initial variant did in early 2020, but it is something to monitor as we move forward, particularly regarding how state and local governments react.
CONGRESS
Continuing with discussions of government reactions, not much progress was made during the month of July regarding President Biden’s infrastructure bill. After months of discussion, the Senate introduced their version of the bipartisan infrastructure bill on Sunday, August 1st, with hopes of passing it by August 9th prior to the monthlong Senate recess. Senate Majority Leader Chuck Schumer hopes to pass this $1 trillion infrastructure bill along with a separate budget measure that would allow Democrats to approve a separate $3.5 trillion spending package without a Republican vote. The House of Representative is not scheduled back in Washington until September 20th, so it will likely be a while before either bill reaches the desk of President Biden. While midterm elections occurring in November of this year could cause even more of a delay, House Speaker Nancy Pelosi has said that she has no interest in bringing up either bill in the House until both pass through the Senate. This has caused quite the stir among Republicans as most would prefer the passing of the $1 trillion bipartisan infrastructure bill and not the budget measure.6 Not including the two bills mentioned, since March of 2020, the amount of government aid is nearly $6 trillion.7
ECONOMIC DATA
According to a Reuters survey, the economy likely grew at an annualized rate of 8.5% in the second quarter of 2021 which would be the second-fastest GDP growth pace since the second quarter of 1983. First quarter GDP growth checked in at a rate of 6.4% but it is subject to revision. Similar economists project an overall growth rate of 7% for U.S. GDP in 2021, the strongest growth rate since 1984.7 Yes, there are caveats such as the large economic decline in 2020, but this is still very positive momentum for the economic outlook moving forward.
Second quarter earnings were positive as over half of the S&P 500 companies have reported with 90% of those companies beating analyst expectations.8 The national unemployment rate was 5.9% for the month of June, up slightly from the 5.8% seen in May.9 The United States added 850,000 jobs in June, which is the biggest gain since August of 2020 when the initial shutdown was ending. As more jobs are added, companies are finding it more difficult to higher skilled workers which is leading to higher wage growth as potential employees are demanding higher wages. The consumer price index (CPI) was up 5.4% year over year in June as the number surprised for a fourth consecutive month.8

Source (10)
INFLATION AND THE FED
Inflation was still in the headlines throughout July, and while many people look to the CPI as a proxy for inflation, the Federal Reserve Board (the Fed) focuses on the personal consumption expenditure deflator, or PCE-deflator, as it discusses policy. The PCE-deflator was up 4.0% in June of 2021 relative to June of 2020, and it is 0.5% higher than it was in May of this year. Excluding food and energy prices which tend to move more erratically, prices were still up 3.5% from a year ago and up 0.4% month over month. While the Fed has taken a more hawkish stance as of late, the higher than anticipated rise in inflation has challenged the Fed’s timeframe for tightening monetary policy, and on July 28th, the Fed announced its intention to leave interest rates and bond purchases unchanged for now. The Fed is set to revisit tapering bond purchase during the August meeting and most believe they will begin to implement before the end of the calendar year.11
CONCLUSION
The S&P 500 increased for the fifth straight month in July; its longest winning streak since 2018, but treasury yields in the U.S. are the lowest they’ve been in 18 months. According to Hugh Gimber, Global Market Strategist of J.P. Morgan, such a sharp decline in yields would normally imply a significant downgrade to the growth outlook, but there appears to be a wide range of factors behind the move. Demand has been strong as you combine the Fed’s purchases with institutional investors looking to rebalance at the end of the quarter as they take some of their equity gains off of the table. Hugh believes that the bond market is not sending a negative signal about the health of the economy. The current level of Treasury yields appears inconsistent with the strength of the recovery, and in our base case we expect yields to move higher over the remainder of the year.8 To quote Fed policy makers, “The path of the economy continues to depend on the course of the virus.” 1 Growth potential still remains as consumers have plenty of money to spend while the Fed and government officials continue to provide their support. However, the wildcard in this scenario is the Delta variant of the Covid-19 virus. If you asked us in early March of 2020, almost none of us could have envisioned the future large-scale shutdown and the effect on our economy that would follow, and I’m sure most of us are thinking the same thing as of now. While we have a much better handle on health and safety protocols, this is still a new variant of the virus with a small sample size of research relative to the initial alpha variant. As we move through the month of August, Greg Bassuk, CEO of AXS Investments, states, “Of all the months to date, August is really going to be that watershed month where we have enough information between Covid, earnings and economic data that will give investors greater confidence in where we’re moving and the balance of the year.” 1 So, while there is growth potential, it is likely going to be a volatile remainder of the year and we will need continuing monitoring both the virus and the Fed/government response. If you’d like to revisit your portfolio and/or discuss your risk tolerance, please reach out to schedule a meeting today.
1 – https://www.forbes.com/advisor/investing/august-2021-stock-market-outlook/
2 – https://www.investing.com/indices/major-indices
4 – https://covid.cdc.gov/covid-data-tracker/#trends_dailytrendscases
5 – https://covid.cdc.gov/covid-data-tracker/#vaccinations
6 – https://www.cnbc.com/2021/08/02/infrastructure-senate-to-vote-on-bipartisan-bill.html
9 – https://www.statista.com/statistics/273909/seasonally-adjusted-monthly-unemployment-rate-in-the-us/
11 –
https://www2.deloitte.com/us/en/insights/economy/global-economic-outlook/weekly-update.html-2021-06-16/
Returns are based on the S&P 500 Total Return Index, an unmanaged, capitalization-weighted index that measures the performance of 500 large capitalization domestic stocks representing all major industries. Indices do not include fees or operating expenses and are not available for actual investment. The hypothetical performance calculations are shown for illustrative purposes only and are not meant to be representative of actual results while investing over the time periods shown. The hypothetical performance calculations for the respective strategies are shown gross of fees. If fees were included returns would be lower. Hypothetical performance returns reflect the reinvestment of all dividends. The hypothetical performance results have certain inherent limitations. Unlike an actual performance record, they do not reflect actual trading, liquidity constraints, fees and other costs. Also, since the trades have not actually been executed, the results may have under- or overcompensated for the impact of certain market factors such as lack of liquidity. Simulated trading programs in general are also subject to the fact that they are designed with the benefit of hindsight. Returns will fluctuate and an investment upon redemption may be worth more or less than its original value. Past performance is not indicative of future returns. An individual cannot invest directly in an index.
This material has been prepared for information and educational purposes and should not be construed as a solicitation for the purchase or sell of any investment. The content is developed from sources believed to be reliable. This information is not intended to be investment, legal or tax advice. Investing involves risk, including the loss of principal. No investment strategy can guarantee a profit or protect against loss in a period of declining values. Investment advisory services offered by duly registered individuals on behalf of ChangePath, LLC a Registered Investment Adviser.


P:
888.798.2360 F:
913.661.1183
6330 Sprint Pkwy Suite 400, Overland Park, KS 66211
Disclosure: Continuity planning offered through CreativeOne Wealth, LLC and CreativeOne Securities, LLC. CreativeOne Wealth, LLC. advisory services offered through CreativeOne Wealth, LLC, a Registered Investment Adviser. CreativeOne Securities, LLC. Member FINRA/SIPC and an Investment Advisor.
Privacy Policy | ADV Part 2A | Form CRS
© 2023 Creative One Marketing Corporation, CreativeOne Wealth, LLC and CreativeOne Securities, LLC.