Market Commentary | August 2021
THE MARKET
August was one of the year’s best months for the investors as the S&P 500, the Dow Jones Industrial Average (DJIA), and the NASDAQ Composite each hit new all-time highs. It is the seventh straight month of increases for the S&P 500 as it finished the month up 2.90%, and the index is now up 20.41% for the year.1 Coming in alongside market highs was earnings growth as 98% of companies in the S&P 500 have now reported for the second quarter. Earnings were expected to be higher this year relative to the lower levels caused by the virus in 2020 as estimates for second quarter earnings growth came in at 63%. However, with almost all companies having reported, earnings growth significantly outperformed expectations as it came in at 89% helping the market reach new highs.2
| Index Returns (as of 8/31/2021) | Level | July/QTD | YTD |
|---|---|---|---|
| S&P 500 | 4,522.68 | 2.90% | 20.41% |
| Dow Jones Industrial Average | 35,359.08 | 1.21% | 15.53% |
| NASDAQ Composite | 15,259.2 | 4.00% | 18.40% |
| Russell 2000 | 2,273.77 | 2.13% | 15.14% |
| MSCI EAFE | 2,356.42 | 1.52% | 9.73% |
| MSCI Emerging Markets | 1,308.67 | 2.42% | 1.35% |
| U.S. Aggregate Bond | - | -0.19% | -0.69% |
Source (1)
The DJIA finished August above 35,000 as it was up 1.21% during the month and is now up 15.53% on the year. Leading the indices this month was the NASDAQ as it was up 4.00% in August and is up 18.40% on the year. Small caps stocks finished the month up over 2.00% and are up over 15% on the year. The MSCI EAFE index is inching closer to double digits for the year as it is now up 9.73%, and the MSCI EM index is now back in positive territory up 1.35% on the year. After a positive July, the U.S. Agg fell 0.19% during August and is now down 0.69% on the year.1
THE ECONOMY
Job creation, unemployment, and wage growth all came in with better-than-expected numbers to start the month only to disappoint with numbers from September 3rd. Job creation was expected to be around 720,000 new hires in the month of August, but the Labor Department reported only 235,000. The chart below shows job creation since the start of 2020, and many point to the Delta variant of the virus as to why job creation came in unexpectedly low in August. “The labor market recovery hit the brakes this month with a dramatic showdown in all industries,” said Daniel Zhao, senior economist at jobs site Glassdoor. “Ultimately, the Delta variant wave is a harsh reminder that the pandemic is still in the driver’s seat, and it controls our economic future.”
3
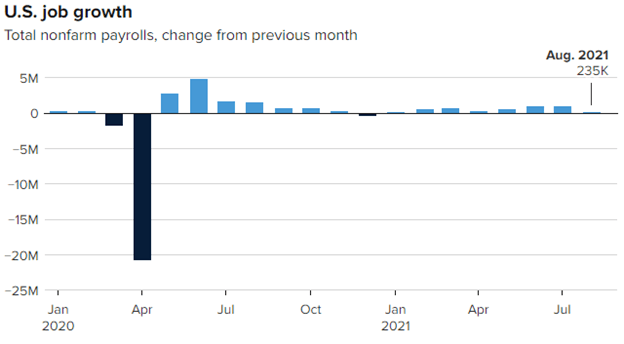
Source (3)
Unemployment fell from 5.4% to 5.2% which was more in line with analyst expectations this month. Employment numbers sill remain below pre-Covid levels as there are 5.6 million fewer workers today than before the pandemic. It is not because of lack of jobs though, as the placement firm Indeed estimates that there are 10.5 million open jobs, which is comfortably a record for the United States’ labor market.3 With 7.5 million workers about to lose their unemployment benefits on September 6th, the labor reports for September will be a telling sign.4 Combine that with the Delta variant causing issues and we could see changes from Congress. These numbers will be key for the Federal Reserve Board (Fed) as they look to taper their bond purchasing sometime later this year. With the strong economic numbers from July that were reported on August 6th, many thought the tapering was a foregone conclusion, but September will be an important month regarding Fed policy. The Fed is likely to announce the tapering of bond purchases in November, but that does allow them time to receive more data on the labor market recovery and economic growth.5 For reference, when the Fed buys bonds, it stimulates the economy by increasing the money supply. Also, keeping interest rates lower allows for more borrowing with lower financing costs and investing to stimulate the economy. These are two levers that the Fed has been pulling since the start of this pandemic. The Fed has made it clear that increasing their target interest rate will not occur until after bond purchases have been tapered.
While eyes will be on the Fed regarding their policy decisions, there are also big items on the docket for Capitol Hill with the budget resolution bill and the infrastructure bill. In a party-line vote, the House of Representatives passed the $3.5 trillion budget resolution bill on August 24th. While this allows for $3.5 million more in spending, Democrats still have hurdles to overcome as this vote allows them to write and approve a massive spending package without Republicans. They will still need to write and gain support for a budget bill before they approve the infrastructure bill which is tentatively set to be voted on by September 27th.6 September is sure to be an important month from all perspectives as it relates to our economy.
CONCLUSION
While there were many headline grabbing negatives in the month of August, they could still not keep the market down. We had inflation concerns, labor shortages, and the Delta variant along with many others. These topics will continue to stay top of mind for the remainder of the year, and we can’t expect the same type of market performance or a smooth ride. Volatility spiked in mid-August as the VIX hit 24.74 before calming down to end the month as it fell to 16.67. 7 We expect these bouts of volatility to continue throughout the remainder of 2021 in our headline driven society. It’s important that investors maintain discipline through the volatility as the image below shows the result of the average investor trying to time the market through volatility rather than staying the course with a disciplined 60% equity and 40% fixed income (60/40) or 40/60 type of portfolio.

Source (8)
The Fed will eventually start their tapering of bond purchases, virus talk is sure to pick up during the Holiday season with potential restrictions, and Congress will try to work through both the infrastructure bill and a budget plan. Second quarter earnings season is almost complete, and we’ve had peak growth with peak earnings. As one can see, the remainder of 2021 expects to be quite eventful and there should be no surprise if the market follows suit from a volatility perspective. There are concerns on the horizon. Because of these unknowns, we continue to recommend a disciplined portfolio according to your risk tolerance and investment objectives. If you’d like to update your risk tolerance or revisit your investment objectives, please reach out to schedule a meeting today.
1 – https://www.investing.com/indices/major-indices
2 – https://www.nasdaq.com/articles/august-2021-review-and-outlook-2021-09-01
3 – https://www.cnbc.com/2021/09/03/jobs-report-august-2021.html
4 – https://www.cbsnews.com/news/enhanced-unemployment-benefits-end-whats-next/
6 – https://www.cnbc.com/2021/08/24/house-passes-budget-resolution-advances-infrastructure-bill.html
7 –
https://finance.yahoo.com/quote/%5EVIX/history/
Returns are based on the S&P 500 Total Return Index, an unmanaged, capitalization-weighted index that measures the performance of 500 large capitalization domestic stocks representing all major industries. Indices do not include fees or operating expenses and are not available for actual investment. The hypothetical performance calculations are shown for illustrative purposes only and are not meant to be representative of actual results while investing over the time periods shown. The hypothetical performance calculations for the respective strategies are shown gross of fees. If fees were included returns would be lower. Hypothetical performance returns reflect the reinvestment of all dividends. The hypothetical performance results have certain inherent limitations. Unlike an actual performance record, they do not reflect actual trading, liquidity constraints, fees and other costs. Also, since the trades have not actually been executed, the results may have under- or overcompensated for the impact of certain market factors such as lack of liquidity. Simulated trading programs in general are also subject to the fact that they are designed with the benefit of hindsight. Returns will fluctuate and an investment upon redemption may be worth more or less than its original value. Past performance is not indicative of future returns. An individual cannot invest directly in an index.
This material has been prepared for information and educational purposes and should not be construed as a solicitation for the purchase or sell of any investment. The content is developed from sources believed to be reliable. This information is not intended to be investment, legal or tax advice. Investing involves risk, including the loss of principal. No investment strategy can guarantee a profit or protect against loss in a period of declining values. Investment advisory services offered by duly registered individuals on behalf of ChangePath, LLC a Registered Investment Adviser.


P:
888.798.2360 F:
913.661.1183
6330 Sprint Pkwy Suite 400, Overland Park, KS 66211
Disclosure: Continuity planning offered through CreativeOne Wealth, LLC and CreativeOne Securities, LLC. CreativeOne Wealth, LLC. advisory services offered through CreativeOne Wealth, LLC, a Registered Investment Adviser. CreativeOne Securities, LLC. Member FINRA/SIPC and an Investment Advisor.
Privacy Policy | ADV Part 2A | Form CRS
© 2023 Creative One Marketing Corporation, CreativeOne Wealth, LLC and CreativeOne Securities, LLC.