Blog Layout
Market Commentary | March 2020
Rob Kellogg, CFA® • Apr 06, 2020
THE MARKET
After posting nearly a 6% return in the first three trading days of March, the S&P 500 officially entered bear market territory and closed the month down 12.5% amid fears of the growing COVID-19 pandemic and a price war over oil.
The index finished the first quarter down 20% which is its worst showing since the final quarter of 2008. The Dow Jones Industrial Average (DJIA) finished the month down 13.7% which led to its worst ever first quarter performance of negative 23.1%.1
Both of the indexes experienced their worst monthly performance since October of 2008.2
All 11 sectors of the S&P 500 finished the quarter in negative territory with the worst being Energy down over 50% and the best performing sector being Information Technology (IT) down just less than 12%.3
The IT sector led to slightly better performance in the technology heavy NASDAQ composite as it finished the month down 10.1% and the quarter down 14.2%.1
The month of March was unlike anything that we’ve experienced before as the coronavirus pandemic turned our lives upside down. Many states have issued stay-at-home orders as non-essential businesses are closed and the vast majority of America is either out of work or working from home. When taking a step back to look at the month and how its events will shape the future, it makes sense to look at things in stages. What do we know about the virus? How is the virus affecting the economy? What fiscal and monetary policy is being used to aid the economy? And lastly, as investors, how do we invest in today’s environment?
THE VIRUS
There is a lot about the disease that we don’t know, but it is wise for us to look at what we do know and how that will affect us. Nothing has really changed in the last week or so, and it’s almost as if the disease is like a hurricane heading towards the coast. We are trying our best to frantically prepare for it as we know it’s about to hit land and the worst is yet to come, but the issue is that we really don’t know what the worst will entail. Looking at the left side of image below, you can see the rate of cases, recoveries, and fatalities by region. Cases on the left, recoveries in the middle, and fatalities on the right. The grey represents China’s numbers and the blue represents the world excluding China. It looks quite scary as the death rate outside of China is 5%. However, it is likely the recovery rate is much higher due to the lack of expansive testing, but it is a sobering image to look at. On the right side, you can see the growth in cases versus the crude mortality rate. Cases grew, they then fell, remained steady, and fell again.
The first rise and fall are likely a function of testing and the initial uptick as the virus gained ground. Pay close attention to the area around March 17th when the virus grew right around 200% for a steady period of time. Without risk mitigation like social distancing, the novel virus would go unchecked, and the steady rate surrounding March 17th can lead us to the opinion that it is the rate that the virus would grow at if left to its own devices. Meaning cases would triple every week and half of the United States would contract COVID-19 within three months. With mitigation in place and better testing, the death rate is likely to go down over time. One country that we can look at for guidance is South Korea. They seem to have done a good job taming the virus and are experiencing a death rate of roughly 1.7% as of April 2nd.6
Even that seems to be high, but if you cut the number in half to 0.85% and multiply that by half of the U.S. population, it is over 1.3 million people dying and it’s easy to see why these social distancing measures are being put in place. While we all hope that this is over sooner rather than later, saying that this will pass in a few weeks may be overly optimistic. As soon as citizens relax the social distancing measures, it is likely that the growth rate in the number of cases will flare up again. In an attempt to flatten the disease curve, we must keep some degree of social distancing in place until we get better treatment or a vaccine. Many believe a vaccine will be in place within 12-18 months.7
As Chief Global Market Strategist from J.P. Morgan, Dr. David Kelly says, “2020 will be the year of the virus, 2021 is the year of the recovery, and 2022 is back to normal”.5
THE ECONOMY
For the remainder of 2020, we will be looking at a social distancing economy. As we take measures to flatten the disease curve, we will also be extending the timeline of economic recovery. If we lose sight of the health crisis, we may achieve a quicker economic recovery, but at a massive cost. On the flip side, if we focus on the health crisis, the economy must adapt and is forced into a slower recovery. This is the dilemma and it leaves us with a social distancing recession.
Morgan Stanley estimates that U.S. first quarter real GDP will be down over 3%,8
but it is harder to look at for guidance as we experienced an excessive amount of hoarding before many of the shutdowns in the second half of March. However, real GDP is projected to be down heavily in the second quarter as a result of the virus. Goldman Sachs estimates that it could be down 34%.9
The charts below show some of the industries that will be greatly affected by the virus and their percentages related to GDP and employment. They make up nearly 20% of both.
Unemployment is likely to reach the mid-teens9
but could raise into the high teens if more people decide to file as a result of the recently passed CARES Act (Coronavirus Aid, Relief, and Economic Security). That will make the highest level of unemployment that we’ve seen since the number was 10.8% in November of 1982 and 10% in October of 2009.11
We’ll touch on some specifics of the CARES Act later and how it relates to retirees, but the act isn’t designed to help the economy grow faster. It is designed to keep it in suspended animation. It is a $2.2 trillion stimulus package that is three times the size of the bill passed in the wake of the 2007-2009 Financial Crisis by the Obama administration. It is designed to help both workers and companies. Workers will get paid in the form of a check from the government with limits based on their income. $250 billion will go towards expanding, enhancing, and extending unemployment.
Small businesses will receive forgivable loans, which are actually grants, based on the percentage of their workforce that they keep employed. And bigger companies will receive loans with stipulations on dividends and stock buy backs.12
We are going to see a deep recession, however actions have already been taken by the government with the passage of the CARES Act and the Fed’s rate cut. These actions will hopefully lessen the impact on the US workforce.13
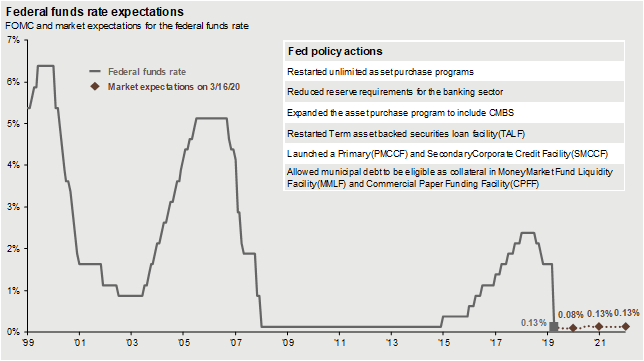
As you can see below, rates have been cut to zero, there is basically unlimited quantitative easing, there are hardly any reserve requirements, and programs have been enhanced to promote lending.
Eventually, we will come out of this and it is our opinion that there will be a tremendous amount of pent up demand. The amount of funds on the sidelines may open the floodgates in consumer discretionary sectors. The CARES Act is likely to keep the economy afloat for a few months, and it’s highly probable that we will need another stimulus at some point. There is some fear of inflation down the road because of the stimulus, but not so much in the short or medium term with the swift contraction in demand relative to supply. It’s also possible that the Fed could tighten their policy down the line as we are going to see two massive years of national debt increases. There are no free lunches, and eventually somebody will have to pay. We believe that it will likely come in the form of taxes on the wealthy at some point as most administrations will not want to tax companies heavily and lead to another immediate downturn in the stock market. For now, the government is willing to do whatever it takes to keep the economy alive. The economy will experience a fall, a stall, and a surge. The fall has already happened, the stall is likely to last multiple quarters, and the surge will occur as we recover after the pandemic has subsided due to a vaccine.
THE OIL INDUSTRY
Regarding Oil, COVID-19 led to a destruction in demand for the energy sector as less travel and transportation calls for less oil. When you combine that with the excess supply generated by the current price war between Russia and Saudi Arabia, you end up with the largest ever price drop in oil as prices fell over 50% in the month of March. The price of WTI crude oil fell by two-thirds in the first quarter down to just over $20 a barrel.2
Essentially, Saudi Arabia attempted to cut production in oil to boost prices, and Russia did not agree with the strategy. This forced Saudi Arabia’s hand as they decided they could outlast Russia in a price war, and the Saudis increased production while slashing prices. Saudi Arabia relies on the United States in somewhat of an unwritten protection agreement in case they ever get into trouble with Iran or others. Therefore, the Saudis are likely to experience tremendous pressure from the United States to come to a deal sooner rather than later. As of April 2nd, U.S. President Trump tweeted that the two countries are expected to come to an agreement.15 While the good news from Trump caused an increase in oil prices, it will be challenging for them rebound back up into the high $40’s due to the surplus created by the pandemic. This will be a tough year for oil in the U.S. as the breakeven price for U.S. shale producers is roughly between $48 and $54.16
A POSSIBLE PATH TO RECOVERY
Seeing what we know about the virus and how it will potentially affect the economy, how should one invest in this environment? Let’s start with looking at recessions and downturns relative to the economy. The unemployment high lags the recession bottom which lags the market bottom. In nine of the last ten recessions, it has been the case that the market has found its bottom in the middle or towards the beginning of a recession. Almost always, there is a market bottom and then a recession bottom. Every recession is different, but the market anticipates and reacts to bad news first and then subsequently recovers first. After the market uptick in the last week of March, some may wonder if it is possible to have hit a bottom so quickly when it took so long to hit the bottom during the 2007-2009 Financial Crisis. I want to point out that most analysts weren’t calling for a recession in 2007 or even the first half of 2008. No one knew that we were in one yet. It was a very slow drift down from December of 2007 through the summer of 2008, and then Lehman Brothers filed for bankruptcy that September.17
The recession essentially began in October of 2008, followed by the market bottom in March of 2009,1
the economy bottom in June of 2009,18
and then the unemployment high in October of 2009.11
Every recession is different, and it’s possible that this one just experienced a much quicker bottom in roughly a month’s time. No one wants to call the bottom, and we aren’t doing that. We are simply stating that it is possible for the bottom to have occurred on Monday, March 23rd.1
As we mentioned, the economy will likely fall, then stall, then surge in a U-shaped fashion. We have fallen, and the second quarter is going to be a rough quarter from an economic perspective, but the question is how long do we stall? Do we move sideways through Q3 and Q4? Or do we start a slight recovery in Q3 before a surge in 2021 with a vaccine? If the latter is the case, it’s very possible that the bottom could have occurred on March 23rd. It is also possible that the market can get shocked by more negative news and we could flirt with the March 23rd low again, or even go through it. We do know the second quarter will likely continue to be volatile, along with the remainder of the year as the election approaches. At some point though, the market will focus on a rebound. As we get better clarity on the duration of social distancing protocols and treatment of the virus or a vaccine, the market will begin to recover and establish a more sustainable bottom before its trend upward.
INVESTING
To borrow some investing principles from our friends at J.P. Morgan, we recommend sticking to your plan with a diversified portfolio.20
Times like these are when people lose faith in investing, and equities are still one of the main wealth generators. They are how we transfer our income into wealth. Looking at the current environment, the market peak on February 19th wasn’t that long ago. Even if it takes a while to get back to those levels, the equity returns are likely to be much higher than we realize on an annual basis. As of March 30th, the two-year average return it will take to get back to the peak in the S&P 500 is a 17% return per year. If it took 4 years, that is a 9% return per year. Even if it took 8 years, that is an 8% return per year.1
It is unlikely that any sort of fixed income investment you can find will generate an 8% annualized return. This is evidence as to why it isn’t necessary to de-risk your portfolio right now. Equities are also a good source of income at the time being because the divided on the S&P 500 is 2.5%, which is significantly higher than that of the 10-year treasury yield which is 0.7%.21
Now that we’ve made a case for equities, it is still wise to maintain your asset allocation. While fixed income may have not provided the yield one would have liked, the asset class did meet expectations regarding protection. A 60% equity and 40% fixed income portfolio (60/40) was down half as much as an all equity portfolio during the recent downturn.1
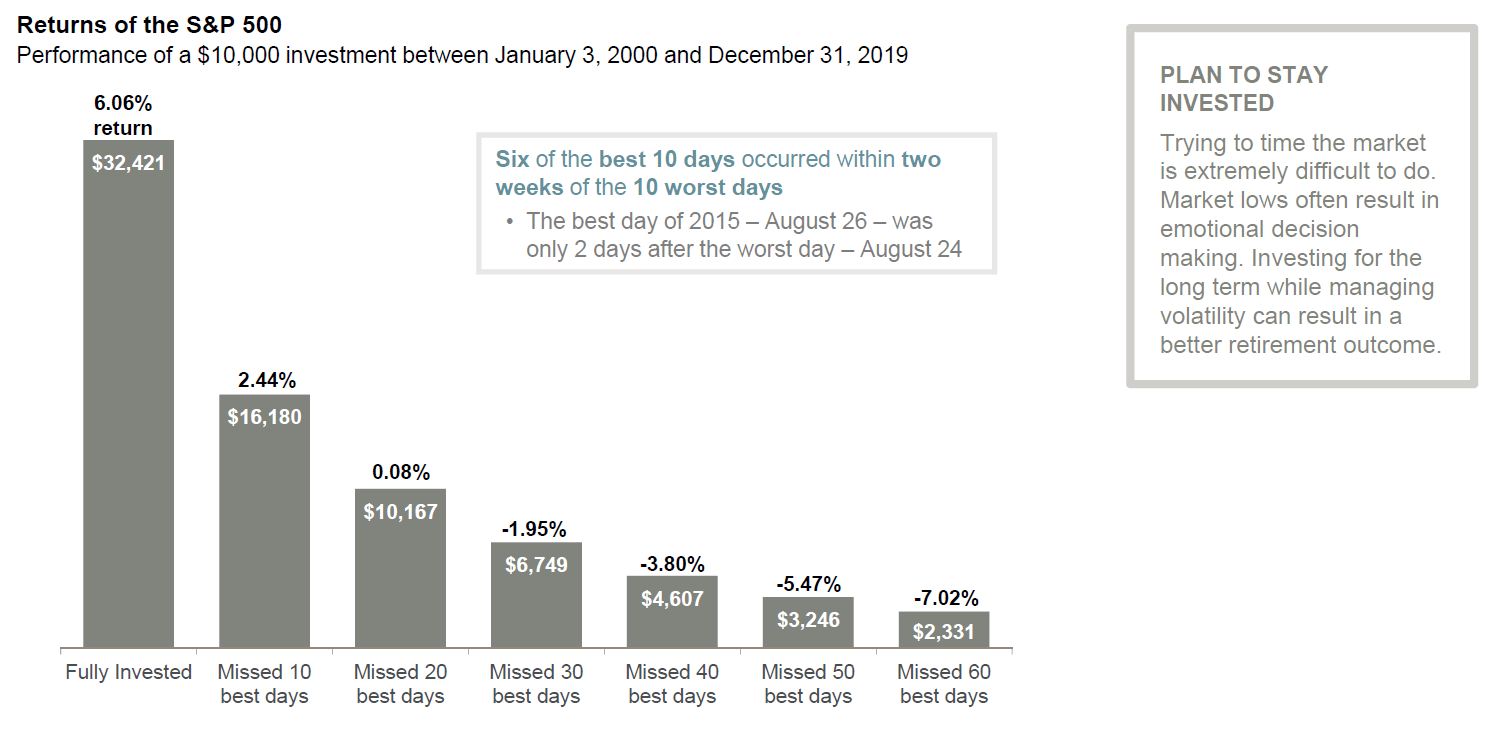
Lastly, we will touch on timing. In our view, it isn’t wise to exit the market or lower your equity exposure, but it is wise to rebalance. The recent downtrend forced you into a more conservative portfolio than the one established by your risk tolerance. A 60/40 portfolio as of January 1st, 2020, became a 52/48 portfolio after March 23rd.1
It makes sense to look at rebalancing your portfolio to make sure you are aligned with your risk tolerance and that you aren’t taking too conservative of an approach. We’ve discussed timing before, and the below slide is one that we’ve sent out a few times, but this time we have proof during the month of March. Timing hurts everyone. Market physics tells us that the best days and the worst days occur close together. Look at the writing in blue in the top middle of the image to the right.
On March 16th, the S&P 500 was down 11.98%, and then on March 24th the index was up 9.38%. That is the best and worst days of the market occurring within 8 days of each other. We had an up day of 6%, and three significant down days in between. March 24th and 25th were the first two positive days in a row since the index peaked on February 19th.1 More evidence that it is a fool’s errand trying to time the market.
If you’d like to reassess your risk tolerance or revisit your asset allocation and discuss rebalancing, don’t hesitate to reach out.
CARES ACT IMMEDIATE IMPACT RELATED TO RETIREMENT 23
Required Minimum Distributions (RMDs) are waived for 2020. The main reason is for account owners to avoid the large tax bill. Meaning they won’t have to take an RMD based on account values at the end of 2019 when the market was much higher.
People can also withdraw up to $100,000 from their qualified retirement accounts if it is for coronavirus-related purposes. This includes, but is not limited to, people who test positive for COVID-19, as well as those who are out of work due to being laid off, furloughed, or quarantined. They will still have to pay ordinary income taxes on the amount withdrawn, but it can be paid over a 3-year period.
5 J.P. Morgan – Guide to the Markets – U.S. Data are as of March 31, 2020. John Hopkins CSSE. J.P. Morgan Asset Management. Growth in cases is the week-over-week percent change in cumulative cases outside of China. The mortality rate is the number of fatalities reported per the total number of confirmed cases reported outside of China.
10 J.P. Morgan – Guide to the Markets – U.S. Data are as of March 31, 2020. Bureau of Economic Analysis, Bureau of Labor Statistics, Factset, S&P 500. J.P. Morgan Asset Management. Consumer spending (2019 annual): membership clubs, sports, amusement parks, campgrounds, movies, theaters, museums, libraries, casino gambling, purchased meals and beverages, packaged tours, air and water transportation, hotels and motels, and select retail goods and services. Employment (January 2020): air and water transportation, transit and ground passenger transportation, support activities for air and water transportation, arts, entertainment, recreation, accommodation, food services and drinking places, and retail ex-food and beverage stores. Earnings (2019 operating): hotels restaurants and leisure; airlines; select entertainment and travel booking companies; multiline and specialty retail; and textiles apparel and luxury goods.
14 J.P. Morgan – Guide to the Markets – U.S. Data are as of March 31, 2020. Bloomberg, FactSet, Federal Reserve. J.P. Morgan Asset Management. Market expectations are the federal funds rates priced into the fed futures market as of the following date of the March 15, 2020 emergency cut and are through December 2022.
20 https://am.jpmorgan.com/us/en/asset-management/gim/protected/adv/insights/principles-for-investing
22 J.P. Morgan Asset Management analysis using data from Bloomberg. Returns are based on the S&P 500 Total Return Index, an unmanaged, capitalization-weighted index that measures the performance of 500 large capitalization domestic stocks representing all major industries. Indices do not include fees or operating expenses and are not available for actual investment. The hypothetical performance calculations are shown for illustrative purposes only and are not meant to be representative of actual results while investing over the time periods shown. The hypothetical performance calculations for the respective strategies are shown gross of fees. If fees were included, returns would be lower. Hypothetical performance returns reflect the reinvestment of all dividends. The hypothetical performance results have certain inherent limitations. Unlike an actual performance record, they do not reflect actual trading, liquidity constraints, fees and other costs. Also, since the trades have not actually been executed, the results may have under- or overcompensated for the impact of certain market factors such as lack of liquidity. Simulated trading programs in general are also subject to the fact that they are designed with the benefit of hindsight. Returns will fluctuate and an investment upon redemption may be worth more or less than its original value. Past performance is not indicative of future returns. An individual cannot invest directly in an index. Data as of December 31, 2019.
Returns are based on the S&P 500 Total Return Index, an unmanaged, capitalization-weighted index that measures the performance of 500 large capitalization domestic stocks representing all major industries. Indices do not include fees or operating expenses and are not available for actual investment. The hypothetical performance calculations are shown for illustrative purposes only and are not meant to be representative of actual results while investing over the time periods shown. The hypothetical performance calculations for the respective strategies are shown gross of fees. If fees were included returns would be lower. Hypothetical performance returns reflect the reinvestment of all dividends. The hypothetical performance results have certain inherent limitations. Unlike an actual performance record, they do not reflect actual trading, liquidity constraints, fees and other costs. Also, since the trades have not actually been executed, the results may have under- or overcompensated for the impact of certain market factors such as lack of liquidity. Simulated trading programs in general are also subject to the fact that they are designed with the benefit of hindsight. Returns will fluctuate and an investment upon redemption may be worth more or less than its original value. Past performance is not indicative of future returns. An individual cannot invest directly in an index.
Advisory Services offered through ChangePath, LLC a Registered Investment Adviser.

Source (4)

Source (5)
"As soon as citizens relax the social distancing measures, it is likely that the growth rate in the number of cases will flare up again."

Source (10)
Source (14)
"The price of WTI crude oil fell by two-thirds in the first quarter down to just over $20 a barrel."2

Source (19)
"As of March 30th, the two-year average return it will take to get back to the peak in the S&P 500 is a 17% return per year."
Source (22)
"People can also withdraw up to $100,000 from their qualified retirement accounts if it is for coronavirus-related purposes."

November was a dizzying month for investors. The highlight? Earnings. 82% of companies1 beat estimates this quarter, despite headwinds such as supply chain constraints and inflation. The market’s biggest muse? Elon Musk’s twitter handle, with tweets such as (paraphrased) “should I sell 10% of my Tesla stock?” The most exciting job? Fed watcher. We started tapering, saw a plethora of hot inflation data, and gleaned insight from Federal Reserve Chair Jerome Powell on the last day of the month. November 2021 Market Returns

October was another positive month for the markets after September’s pullback. So far in 2021, the S&P 500 had nine positive performing months, September being the only hold out. The index ended up 6.9%, even though the first week of the month started a bit volatile. However, 2021 is looking robust, even if November and December aren’t large contributors, as the YTD performance through October is 23.9%. 1

September ended the streak of seven positive months in a row for the S&P 500 as it was the first negative month for the index since January of this year. The index ended the month down 4.76%, but it is still up nearly 15% on the year. That is the worst monthly decline for the index since March of 2020 when it fell 12.51%. 1

August was one of the year’s best months for the investors as the S&P 500, the Dow Jones Industrial Average (DJIA), and the NASDAQ Composite each hit new all-time highs. It is the seventh straight month of increases for the S&P 500 as it finished the month up 2.90%, and the index is now up 20.41% for the year. 1 Coming in alongside market highs was earnings growth as 98% of companies in the S&P 500 have now reported for the second quarter. Earnings were expected to be higher this year relative to the lower levels caused by the virus in 2020 as estimates for second quarter earnings growth came in at 63%. However, with almost all companies having reported, earnings growth significantly outperformed expectations as it came in at 89% helping the market reach new highs. 2

The S&P 500 continued to climb for the fifth straight month as the index hit a new all-time high on July 29 th . 1 The index finished the month up 2.27% and is now up 17.02% on the year. The Dow Jones Industrial Average (DJIA) and the NASDAQ Composite both increased during the month as well finishing up 1.26% and 1.20% respectively. Both indices are now comfortably in double digit returns for the year. Small cap stocks took a significant hit as the Russell 2000 fell 3.65% during the month, but it is still up 12.73% on the year. As investors move some of their equity gains into fixed income and the Fed continues with their asset purchases, bond demand has increased leading to a return of 1.12% for the U.S. Agg in the month of July. It is now down just 0.50% on the year. 2

The S&P 500 Index continues to climb in June as it finished the month up 2.22% leading to a 14.41% increase on the year. The technology heavy NASDAQ led the way during the second quarter as it was up 9.50% on the quarter following a strong June, and it is now up 12.50% on the year. The Dow Jones Industrial Average (DJIA) did not follow suit during the month of June as it was down 0.08%, but the index is still up nearly 13% on the year. 1

Equities fell on the last trading day of April as investors likely took their share of profits after positive news regarding corporate earnings and economic data. However, the major U.S. indices still finished in positive territory for the third straight month as the S&P 500 has hit 25 record highs thus far in 2021. 1

The markets started off strong in May before running into inflation fears towards the middle of the month. After those fears were somewhat curbed by the Fed, markets rallied to end the month. The S&P 500 index is up nearly 12% on the year after it finished the month of May up 0.55%. This is the fourth positive month in a row for the index after it finished down just over 1% in January. The Dow Jones Industrial Average (DJIA) finished the month up nearly 2% and is now up 12.82% on the year. The technology heavy NASDAQ did not fair as well during the month as it declined 1.53% and is now up 6.68% on the year. Small cap stocks were relatively flat for the month as the Russell 2000 finished up 0.11%. The MSCI EAFE and EM indices both finished in positive territory as well. 1 As we enter the summer months, June has traditionally been a weak month for markets as the DJIA is averaging 0.12% over the last 50 years, and it is down an average of 0.7% over the last 20 years. However, July and August are traditionally good months for the index as it averages an increase of 3% over its 125-year history. 2

After a volatile month, the S&P 500 finished at a record high when the markets closed on March 31 st . The index finished the month up 4.24% and is now up 5.77% on the year. As the economic recovery continues, the Dow Jones Industrial Average led the monthly performance numbers as it finished up 6.62% and is now up 7.76% on the year. The technology heavy NASDAQ finished the month in positive territory, but it continues to lag the other two indices after outperforming both in 2020. The index finished the month up 0.41% and is now up 2.78% on the year. Small cap stocks continued to inch higher as the Russell 2000 ended the month up 0.88% and is now up 12.44% on the year. The MSCI EAFE index is up just under 3% on the year after a positive month, however the MSCI Emerging Markets index fell 1.70% during the month and is now up 1.95% on the year. The Bloomberg Barclay’s U.S. Aggregate Bond index fell 1.25% in March and is now down 3.37% on the year. 1

Equity markets were modestly higher in the month of February after January saw both the S&P 500 and Dow Jones Industrial Average (DJIA) in negative territory.
P:
888.798.2360 F:
913.661.1183
6330 Sprint Pkwy Suite 400, Overland Park, KS 66211
Disclosure: Continuity planning offered through CreativeOne Wealth, LLC and CreativeOne Securities, LLC. CreativeOne Wealth, LLC. advisory services offered through CreativeOne Wealth, LLC, a Registered Investment Adviser. CreativeOne Securities, LLC. Member FINRA/SIPC and an Investment Advisor.
Privacy Policy | ADV Part 2A | Form CRS
© 2023 Creative One Marketing Corporation, CreativeOne Wealth, LLC and CreativeOne Securities, LLC.