Market Commentary | May 2020
THE MARKET
Equities continued to climb in the month of May as both domestic and international equities finished the month in positive territory.
The S&P 500 ended the month up 4.76% and it is down 4.97% on the year. The index is now down just 10% off its peak in February. The Dow Jones Industrial Average (DJIA) was up 4.66% for the month of May and is down 10.06% on the year. The technology heavy NASDAQ Composite was up 6.89% on the month and is up 6.22% on the year.1 As equities rose, volatility started to fall. The average closing value of the VIX (CBOE Volatility Index) in April was 41.45 and that fell to 30.9 in May.2 While volatility is coming down, the May number for the VIX is still higher than its 30-year average of 19.33, and we do expect that volatility to continue throughout the remainder of the year. In times of volatility, it is vital that we maintain a disciplined investment approach according to our risk tolerance.
THE VIRUS AND THE ECONOMY
COVID-19 has dictated the headlines for much of March, April, and May. While the total numbers of those infected and those that have died from the virus both continue to rise in the United States, they are slowing down. The first chart to the right with the blue lines shows the number of new COVID-19 cases reported each day in the U.S. since the beginning of the outbreak. The second chart with the red lines shows the number of reported coronavirus deaths per day in the U.S. Both charts are as of June 2nd, 2020.
Part of the reason that the U.S. hasn’t had as significant of a decline as seen is other countries is because the United States has caught up to the rest of the world in terms of testing.5 New York and New Jersey, which had some of the highest infection rates in the U.S., have now seen their rates converge to the rest of the country which has been stable for some time now.6 The threat of the virus is still very real and there is still a lot that we don’t know regarding COVID-19. Is there a possibility of a second wave? Does humidity help stop transmission of the virus? While there is speculation regarding the answer to both of those questions along with many others, at the end of the day we don’t have a concrete answer. Social distancing measures are likely to remain as the economy slowly begins to reopen in phases. There continues to be progress on a vaccine, but once again, no firm timetable. The goal at the beginning of the lockdown was to flatten the disease curve and based on the two charts from the previous page most would say that we have achieved that goal. Government officials likely understand that the virus remains a threat and that there is risk in reopening the economy, but they seem to have determined that we are better equipped to handle the virus now than we were in March and we can now assume those risks.
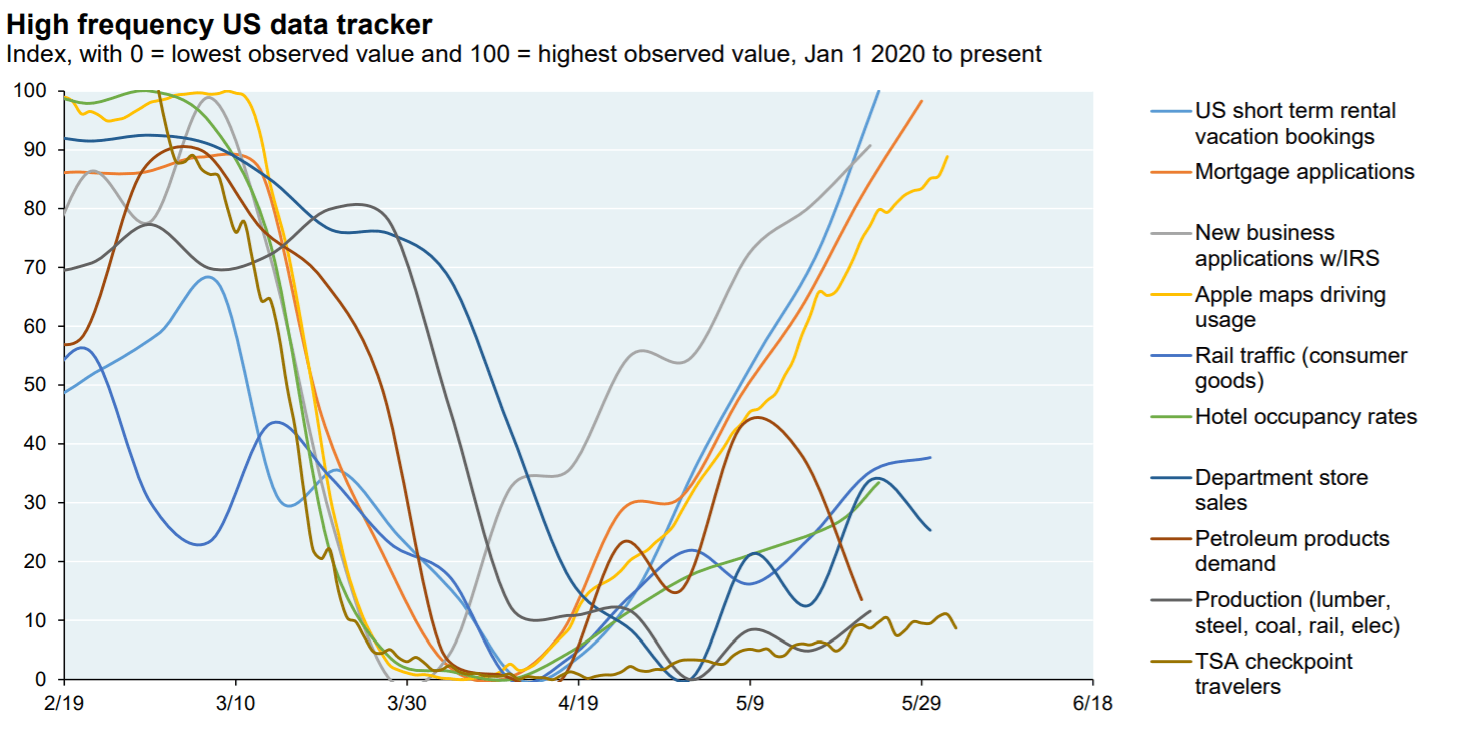
As the stay at home orders began ending around the United States, signs of an economic recovery started to emerge. We are already beginning to see signs of normalcy returning just 2-3 months after the pandemic began. First-time claims for unemployment fell to 2.1 million for the week ending on May 22nd. While a very large number of Americans remain unemployed, that is the lowest weekly number since the start of the crisis. The most positive sign regarding unemployment is continuing claims, those who have been collecting unemployment for at least two weeks. That number fell to just over 21 million, which is a sharp decrease of nearly 4 million from the previous week.7 it is a sign that Americans are beginning to go back to work as the economy reopens. The chart to the right from JP Morgan shows economic activity beginning to pick up throughout the month of May. As you can see, we still aren’t close to pre-virus levels which are shown on the y-axis to the left, but we are greatly improving since the bottom in late March/early April.
CHINA
On the last business day of May, United States President Donald Trump announced that he was revoking Hong Kong’s preferential treatment as a separate customs and travel territory from the rest of China. U.S. officials claim that the city can no longer be said to have a high degree of autonomy from Beijing after China imposed a new security law on the city. However, President Trump did not renounce the signed trade deal with China that some investors feared.11 Chinese government officials told major state-run agricultural companies to pause purchases of some American farm goods including soybeans as Beijing evaluates the ongoing escalation of tensions with the U.S. over Hong Kong.12 Relations between the two countries are tense and the cancellation of the trade deal is still a possibility. As the election gets closer, a hard stance on China may be necessary to earn voters, and the markets will continue to monitor.
MARKET OUTLOOK
While we likely haven’t seen the worst of the economic data yet, the stock market continued to rally as it shifted its focus to the easing of lockdown measures around the world and the affect that would have on economies. It looks as though equity markets were a bit too bearish at the start of the pandemic. As we’ve stated before, the stock market often bottoms before manifestations of a crisis start to improve, and sometimes it even bottoms as those indicators are still getting worse.
While we do believe that there is still room for a market pull back as we stated last month, it may not be as large as many initially thought. Goldman Sachs has now lowered its expectations for how steep that sell off could be. Last month, Goldman Sachs warned of a near 20% pullback that saw a price target for the S&P 500 of 2,400. They have since increased that downside target to 2,750 with a potential upside target of 3,200. Regarding the recent rally, Goldman Sachs analyst David Kostin writes, “The powerful rebound means our previous three-month target of 2,400 is unlikely to be realized. Monetary- and fiscal-policy support limit likely downside to roughly 10%,” with the short-term outlook for the index to be “neutral at best.” 13
To build off what we said in the first paragraph of this month’s commentary and also what we mentioned in last month’s commentary, the S&P 500 is 10% down from its peak in February of this year and the index has also never failed to reach a previous high.1 While the short-term outlook for the index may be murky, it’s important to look at things from a long-term perspective and realize that the index will likely recover that 10% over time.
1 https://www.investing.com/indices/major-indices
3 https://www.cdc.gov/coronavirus/2019-ncov/cases-updates/cases-in-us.html
4 https://www.nbcnews.com/health/health-news/coronavirus-deaths-united-states-each-day-2020-n1177936
5 https://www.bbc.com/news/world-us-canada-52771783
7 https://www.cnbc.com/2020/05/28/weekly-jobless-claims.html
8 hhttps://www.jpmorgan.com/jpmpdf/1320748600038.pdf – WWPA, EIA, AISI, EEI, AAR, Redbook, Census Bureau, TSA.gov, Apple, Smith Travel, MBA, Goggle, AirDNA,
JPMAM. June 03.2020
9 https://www.frbatlanta.org/cqer/research/gdpnow#:
10 https://www.cnn.com/2020/06/03/economy/may-jobs-report-preview/index.html
12 https://www.thestreet.com/investing/goldman-sachs-sees-less-of-a-drop-in-sp-500-index
13 https://fortune.com/2020/06/03/us-hong-kong-special-trade-status-revoke/
Returns are based on the S&P 500 Total Return Index, an unmanaged, capitalization-weighted index that measures the performance of 500 large capitalization domestic stocks representing all major industries. Indices do not include fees or operating expenses and are not available for actual investment. The hypothetical performance calculations are shown for illustrative purposes only and are not meant to be representative of actual results while investing over the time periods shown. The hypothetical performance calculations for the respective strategies are shown gross of fees. If fees were included returns would be lower. Hypothetical performance returns reflect the reinvestment of all dividends. The hypothetical performance results have certain inherent limitations. Unlike an actual performance record, they do not reflect actual trading, liquidity constraints, fees and other costs. Also, since the trades have not actually been executed, the results may have under- or overcompensated for the impact of certain market factors such as lack of liquidity. Simulated trading programs in general are also subject to the fact that they are designed with the benefit of hindsight. Returns will fluctuate and an investment upon redemption may be worth more or less than its original value. Past performance is not indicative of future returns. An individual cannot invest directly in an index.
This material has been prepared for information and educational purposes and should not be construed as a solicitation for the purchase or sell of any investment. The content is developed from sources believed to be reliable. This information is not intended to be investment, legal or tax advice. Investing involves risk, including the loss of principal. No investment strategy can guarantee a profit or protect against loss in a period of declining values. Investment advisory services offered by duly registered individuals on behalf of ChangePath, LLC a Registered Investment Adviser.

Source (1)

Source (3)

Source (4)
Source (8)
"Chinese government officials told major state-run agricultural companies to pause purchases of some American farm goods including soybeans as Beijing evaluates the ongoing escalation of tensions with the U.S. over Hong Kong."
"Regarding the recent rally, Goldman Sachs analyst David Kostin writes, “The powerful rebound means our previous three-month target of 2,400 is unlikely to be realized."


P:
888.798.2360 F:
913.661.1183
6330 Sprint Pkwy Suite 400, Overland Park, KS 66211
Disclosure: Continuity planning offered through CreativeOne Wealth, LLC and CreativeOne Securities, LLC. CreativeOne Wealth, LLC. advisory services offered through CreativeOne Wealth, LLC, a Registered Investment Adviser. CreativeOne Securities, LLC. Member FINRA/SIPC and an Investment Advisor.
Privacy Policy | ADV Part 2A | Form CRS
© 2023 Creative One Marketing Corporation, CreativeOne Wealth, LLC and CreativeOne Securities, LLC.