Market Commentary | February 2021
THE MARKET
Equity markets were modestly higher in the month of February after January saw both the S&P 500 and Dow Jones Industrial Average (DJIA) in negative territory.
The month of February started off strong as the S&P 500 gained 4.65% in the first week of trading, but eventually the market pulled back led by a sell off in technology stocks. Still, the S&P 500 finished the month up 2.61% resulting in a yearly gain of 1.47%. The DJIA finished the month slightly higher at 3.17% and is now up 1.06% on the year. Lagging both was the NASDAQ Composite as it finished the month up just 0.93%, and it is now up 2.36% on the year. The MSCI EAFE and Emerging Markets Indices both increased in the month of February and are now both in positive territory for the year. Leading the pack was the Russell 2000 Small Cap Index as it finished the month up 6.14% and is now up double digits in 2021 at 11.45%. As bond yields continued to creep higher in 2021, the U.S. Aggregate Bond index fell 1.44% and is now down 2.15% on the year.1
THE VIRUS AND THE ECONOMY
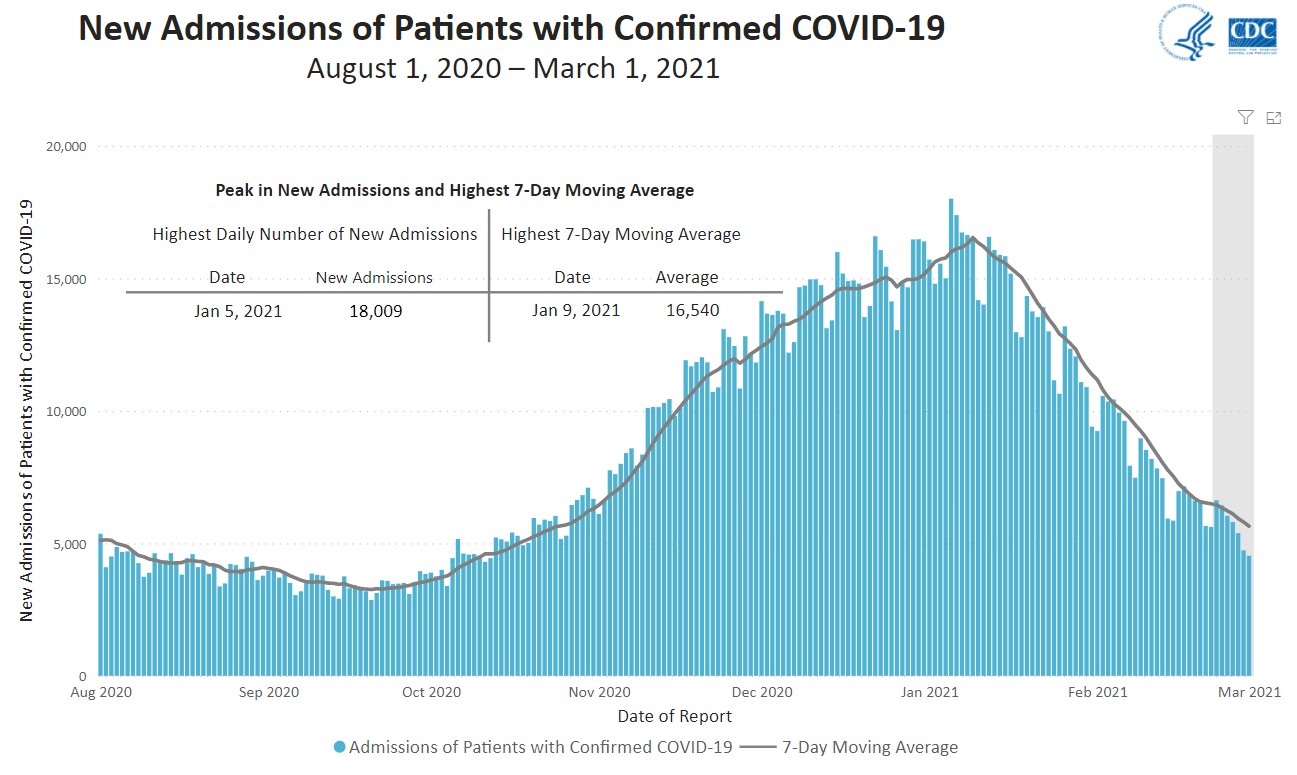
As has been the case for much of the last year, our economy and the stock market are driven primarily by progress against Covid-19. While the weekly number of virus cases and hospitalizations due to the disease spiked as we entered in to 2021, both numbers have fallen significantly in the last month as seen in the charts to the right. The 7-day moving average for vaccine doses given has increased to over 1.5 million per day as of February 25th,2 and this number is likely to continue increasing with the approval of a third vaccine in the United States.3 Chicago Mayor Lori Lightfoot announced that bars can now stay open until 1:00 AM with 50% capacity4 and Texas Governor Greg Abbott lifted the statewide mask mandate while also allowing businesses to open at 100% capacity.5 It is safe to say that government officials are slowly starting to ease restrictions as cases decrease and the vaccine becomes available to more people. While the virus is still a very real threat, these are encouraging signs that will hopefully lead to more progress for the economy.
On Wednesday, March 3rd, payroll processor ADP reported that private sector jobs grew by 117,000 in the month of February, much lower than the 177,000 anticipated. Even though numbers were revised up by 21,000 for the month of January, it is still disappointing to see the February results. The Labor Department is set to release its monthly employment report which includes both public and private sector jobs on Friday, March 5th, and economists expect that number to increase by 180,000 jobs while the employment rate is expected to remain at roughly 6.3%. Nela Richardson, ADP’s chief economist, stated that, “the labor market continues to post a sluggish recovery across the board.” She noted that large-sized companies are still feeling the effects of the virus and the service sector remains well below its pre-virus levels.8 However, as the economy opens up more throughout the year and the vaccine continues its roll out, consumer confidence should rise leading to improved employment through the summer months.
Economic output still remains 2.5% below peak real GDP numbers from the fourth quarter of 2019 and was said to have expanded only “modestly” in the first part of 2021.9 However, businesses remain optimistic looking toward the latter half of the year. There is room for growth in the job market as it has not recovered as quickly as initially hoped, and there is positive news with virus cases declining along with the vaccine rollout and approval of a third version. In addition, the House of Representatives passed a $1.9 trillion pandemic relief package on Saturday, February 27th.10 The Senate is will likely make revisions to the bill but they may pass their version as quickly as this weekend in order for Biden to sign the bill into law by March 14th. After the Senate passes its version of the bill, it will go back to the House for approval before being placed in front of Biden for his signature. The March 14th deadline is important as many unemployment benefits will expire along with some tax incentives for employers.11
Linking the relief package back to the economy and the market, the bill includes $1,400 direct checks to Americans making less than $75,000.13 The savings rate increased by over 100% from 2019 to 2020 after the CARES Act was passed last April meaning that Americans have built up savings that can be used for the pent-up demand as the economy continues to reopen. One should also note that a $1,400 direct check represents a much larger percentage for lower income individuals who also have a propensity to spend rather than save.14 Strong economic growth is likely after the injection of the fiscal stimulus, the continued vaccine rollout, and the continued reopening of the economy.
CONCLUSION
As many have seen in the news over the last week, the yield on the 10-year treasury is rising at a rapid rate. It reached as high as 1.6% during the last week of February. While that still historically low, that number was the highest we’ve seen since Valentine’s Day in 2020.15 Rising treasury yields can signal a weakening demand for U.S. Treasuries or they can signal that the economy is beginning to strengthen, and the pent-up consumer demand will spark spending rather than saving. When you combine the decrease in Covid-19 cases, the continued rollout of the vaccines, pent-up demand, and a massive fiscal stimulus package in the first half of 2021, you are looking a large acceleration in economic growth for the second half of the year. This acceleration of growth can lead to inflation starting to bubble. The Federal Reserve has stated that they will keep target interest rates at 0 – 0.25% through at least 2023 and will continue with their bond purchases throughout the remainder of 2021.16 All of that points to bond yields continuing to rise. If the economy is growing strong and unemployment has lowered as we look towards the end of 2021, it is possible that inflation could be higher than projected. If that is the case, the Fed will likely ease their bond purchasing causing yields to increase even more making high quality fixed income less attractive.17
As Dr. David Kelly from J.P Morgan stated in his weekly market recap, these rates (yields and inflation) are rising for the right reason, an economic recovery, and that is a good sign for equities moving forward.14 Regarding the fixed income portion of your portfolios, the yield on the higher quality fixed income remains historically low, even though it is rising. Therefore, some may be looking to move down the credit spectrum to receive a stronger yield, however those spreads have also narrowed.17 We believe that one needs to set the expectation for fixed income and that expectation is either regarding yield or correlation to equities. Is the fixed income investment in your portfolio meant for income? Is it meant to provide protection when equity markets do falter? Or possibly both? For the longer term, the lower credit instruments will provide yield and growth, but we still believe that high quality fixed income investments will provide the necessary protection in the short term against equities if they are truly overvalued and a correction is on the horizon. There are plenty of moving pieces in the investment universe today as we look at the virus, the economy, and the Fed; because of this, volatility is likely to continue for the foreseeable future and we maintain a recommendation to a diversified portfolio in order to participate in the economic growth while also protecting against said volatility. If you’d like to revisit your portfolio, or if your objectives have changed, don’t hesitate to reach out and schedule some time to review.
1 https://www.investing.com/indices/major-indices
2 https://covid.cdc.gov/covid-data-tracker/#vaccination-trends
5 https://www.cnn.com/2021/03/02/us/texas-governor-mask-mandate/index.html
7 https://covid.cdc.gov/covid-data-tracker/#trends_dailytrendsdeaths
10 https://www.cnn.com/2021/02/26/politics/stimulus-package-covid-relief-house-vote/index.html
11 https://www.cnn.com/2021/03/01/politics/stimulus-programs-expiring-deadline/index.html
12 https://www.daveramsey.com/blog/stimulus-package
13 https://www.cnn.com/2021/02/05/politics/stimulus-checks-congress-negotiations-timeline/index.html
18
https://www.fidelity.ca/fidca/en/investor/sixstrategiesvolatilemarkets
Returns are based on the S&P 500 Total Return Index, an unmanaged, capitalization-weighted index that measures the performance of 500 large capitalization domestic stocks representing all major industries. Indices do not include fees or operating expenses and are not available for actual investment. The hypothetical performance calculations are shown for illustrative purposes only and are not meant to be representative of actual results while investing over the time periods shown. The hypothetical performance calculations for the respective strategies are shown gross of fees. If fees were included returns would be lower. Hypothetical performance returns reflect the reinvestment of all dividends. The hypothetical performance results have certain inherent limitations. Unlike an actual performance record, they do not reflect actual trading, liquidity constraints, fees and other costs. Also, since the trades have not actually been executed, the results may have under- or overcompensated for the impact of certain market factors such as lack of liquidity. Simulated trading programs in general are also subject to the fact that they are designed with the benefit of hindsight. Returns will fluctuate and an investment upon redemption may be worth more or less than its original value. Past performance is not indicative of future returns. An individual cannot invest directly in an index.
This material has been prepared for information and educational purposes and should not be construed as a solicitation for the purchase or sell of any investment. The content is developed from sources believed to be reliable. This information is not intended to be investment, legal or tax advice. Investing involves risk, including the loss of principal. No investment strategy can guarantee a profit or protect against loss in a period of declining values. Investment advisory services offered by duly registered individuals on behalf of ChangePath, LLC a Registered Investment Adviser.
| Index Returns (as of 2/26/2021) | Level | February | QTD/YTD |
|---|---|---|---|
| S&P 500 | 3811 | 2.61% | 1.47% |
| Dow Jones Industrial Average | 30932 | 3.17% | 1.06% |
| NASDAQ Composite | 13192 | 0.93% | 2.36% |
| Russell 2000 | 2201 | 6.14% | 11.45% |
| MSCI EAFE | 2169 | 2.11% | 0.99% |
| MSCI Emerging Markets | 1339 | 0.73% | 3.72% |
| U.S. Aggregate Bond | - | -1.44% | -2.15% |
Source (1)
Source (6)

Source (7)

Source (12)

Source (18)
"We believe that one needs to set the expectation for fixed income and that expectation is either regarding yield or correlation to equities."


P:
888.798.2360 F:
913.661.1183
6330 Sprint Pkwy Suite 400, Overland Park, KS 66211
Disclosure: Continuity planning offered through CreativeOne Wealth, LLC and CreativeOne Securities, LLC. CreativeOne Wealth, LLC. advisory services offered through CreativeOne Wealth, LLC, a Registered Investment Adviser. CreativeOne Securities, LLC. Member FINRA/SIPC and an Investment Advisor.
Privacy Policy | ADV Part 2A | Form CRS
© 2023 Creative One Marketing Corporation, CreativeOne Wealth, LLC and CreativeOne Securities, LLC.