Market Commentary | September 2020
THE MARKET
The third quarter of 2020 has come to an end.
The Holidays are approaching, and after three short months we will turn the page to 2021. The United States’ markets took a step back in the month of September, but for the most part they are still in positive territory on the year. The S&P 500 finished the month of September down 3.8%, lowering its yearly number to a positive 5.6%. The technology heavy NASDAQ fell a bit more ending the month down 5.1% but is still up significantly on the year at 25.33%. The Dow Jones Industrial Average (DJIA) fell 2.18% for the month and is now down 0.91% on the year. All three indexes experienced a positive third quarter.1
THE ECONOMY AND MARKET OUTLOOK
As we mentioned earlier this year, the country will eventually start to adapt to a social distancing type of economy. After a bad first quarter, and a horrendous second quarter in terms of real GDP, third quarter projections are better than anticipated. As of October 1st, the Federal Reserve Bank of Atlanta predicts a 34.6% increase for the third quarter.3 America’s economy is healing as the social distancing economy gets ironed out and begins to normalize. Going out to eat feels relative normal again, albeit with social distancing and a mask. Travel is picking up, and multiple professional sports are underway. It is a different economy than the one we are accustomed to, but it is moving forward, nonetheless. As the economy has fallen and subsequently began to recover over the last few months, so has the market.
Leading the way for the market recovery in 2020 is large cap growth stocks, particularly in the United States as there was a flight to quality. This has led to both value and international stocks being undervalued. A logical person would conclude that it is now wise to lower our weights to U.S. growth stocks, and slightly increase them to both value and international stocks. We do think it is wise to rebalance back to your initial weights, however, we continue to emphasize a diversified portfolio. U.S. growth stocks have outperformed this year despite the negative news because of the large shift to eCommerce and the flight to quality. It’s possible that they continue to outperform throughout the remainder of the year if news surrounding the virus and its vaccine worsens.4 On the other hand, as positive news is released pertaining to the virus, we could see both value stocks and international stocks recover with the economy. That may happen in the near term, or it may happen in 2021 or 2022. It is difficult to predict and that’s why we emphasize a globally diversified portfolio.
THE ELECTION AND THE VIRUS
As we have discussed for most of the year, today’s markets seem to be driven by the headlines. With technology and social media, our headline driven society now has quicker access to the news cycle, leading to increased market volatility in 2020 relative to most years. At the forefront of today’s news cycle, we have the 2020 presidential election and Covid-19. News surrounding either of these topics is likely to dictate the short-term market movements in the coming months. While this news will have immediate short-term effects, there are longer lasting consequences that we also need to consider.
After a sharp increase in the hospitalization rate from the virus to start the summer, that rate has continued to decline over the last three months as shown in the image to the right (Source 5).
-
The image to the right (Source 6) also shows the same trend regarding cases, but you’ll notice a slight uptick in September as students began going back to school. The blue lines are total cases per day, while the red line is a 7-day moving average.
One can see that the virus was becoming quite manageable throughout the summer, but also that we do need to maintain proper social distancing measures to keep it at bay. There are also fears as fall and winter weather approaches. Were the hot, summer months a reason for the decrease in cases over the last few months? Will cases and hospitalizations rise as colder weather arrives? There is no firm answer for these questions, but we do know that the market will react to news surrounding the virus accordingly. It will react to non-health related items as it pertains to the virus such as a stimulus package, and most importantly, it will react to news on the vaccine front. Vaccine news has been positive lately. AstraZeneca and the University of Oxford, the leader to produce a viable vaccine, have restarted trials after a brief pause. Trials were halted around the world after a participant in the United Kingdom became ill, but for the most part, they have restarted globally, however, they are still on hold in the United States.7 Any positive news on a vaccine should help market performance, and as we get clearer signs on a timeframe for when a vaccine is widely distributable, markets could rally or establish a firmer floor. Either way, there will be volatility and it will likely be of the shorter-term variety. It’s important to stay disciplined to your investment approach.
Regarding the election, it is wise to know the consequences that come with either candidate winning. The two main issues being market volatility and taxes. We won’t get too much into the details of the individual tax plans, but it is wise to consult your financial professional to discuss the potential outcomes and their impact on your overall financial plan. With President Trump, we saw the Tax Cuts and Jobs Act (TCJA) in 2017. It’s possible for more changes, but at this point, we have an idea of what to expect from the Trump administration. On the flip side, we are still learning about the tax agenda from the Democrats should they regain power in Congress and the presidency. Michael Kitces, one of our favorite financial bloggers here at ChangePath, does a great job outlining Biden’s tax plan, but here a few points of emphasis to note. Biden’s tax plan would:
- Increase the top ordinary income tax rate back to 39.6% - it is currently at 37%
- Eliminate the qualified business income (QBI) tax deduction for those earning more than $400,000
- Cap the value of itemized deductions at no more than 28% - affects those earners whose marginal tax bracket is over 28%
- Quite important to advisers and their clients, it will implement a flat credit to replace deductions for contributions to retirement accounts
- New and expanded personal income tax credits targeted at lower- and middle-income earners
- Increase long-term capital gains rates back to ordinary income for those totaling over $1,000,000 (all ordinary income)
- Limit 1031 exchanges
- Eliminate the step-up in basis at death
- Return to pre-TCJA federal estate and gift tax exclusion rules
Source (9)
*There is much more information available and there will be more details to iron out, but consult your financial professional and become educated on the topic of taxes as it relates to the election
Regardless of who wins the election, there is likely to be market volatility that follows. We won’t pick a political side or make a political prediction on who wins, but it is possible that the election could end up being contested. The last time we had a contested election was exactly 20 years ago due to the Florida recount when George W. Bush defeated Al Gore to become the 43rd President of the United States. The Supreme Court awarded Bush the presidency on December 11th, 2000, for a date of reference.10 The S&P 500 fell just over 8% in 2000 during the month of November. For context, we were in the middle of the so-called “Dot-com” bubble that began in March/April of that year, but November did experience the largest monthly drop of 2000 and the second largest monthly drop during the bubble aside from September of 2001 after the attacks on September 11th that month.1 The point? We are likely to experience market volatility, and it is likely to be heightened during a contested election. However, the odds do point to a clear winner of the election being produced by the end of election week. Even if it is contested, the public should have a very good idea which candidate will win. At the end of the day, we simply do not know how the election will unfold, but what we do know is that an election will produce more political certainty. We will eventually know the results regarding the presidency and which party controls Congress. That is a good thing for markets as political certainty bodes well relative to uncertainty. At the end of the day, volatility is to be expected. However, that doesn’t mean your long-term investment decisions should be based off how the market is going to perform in the next three months. Remember. Investing should be tied to an overall financial plan. A good plan accounts for many time intervals and your financial needs in each interval. This should include managing for short-term volatility.
CONCLUSION
Bringing it back full circle, we must emphasize the importance of staying disciplined to your investment objective and risk tolerance. Market volatility does not necessarily mean a large market decrease. It means that the market will experience frequent ebbs and flows. At some point in 2021, the dust will settle. The election will be behind us and the results will be accepted. The virus will have taken its toll on the world, but it is likely to be placed in the rearview. Remember, it is not about timing the market, but time in the market. We don’t recommend trying to sell out of your investments just prior to or just after the election. It is too difficult to come out on top. You may miss a market drop, but the odds are not in your favor when it comes to re-entering the market on time. The market could fall, it could rise, but we will end up at similar levels in the long run. Money that is exposed to market risk should be able to withstand the market volatility, and money that is needed in the near-term should be invested in more conservative cash equivalents. Reach out to your financial professional and revisit your financial plan. Make sure that your assets are invested to align with your financial needs and risk tolerance.
1 https://www.investing.com/indices/
2 https://www.massmutual.com/mmfunds/monthly_market_overview.pdf
3 https://www.frbatlanta.org/cqer/research/gdpnow
4 https://am.jpmorgan.com/us/en/asset-management/gim/adv/insights/week-ahead
5 https://gis.cdc.gov/grasp/COVIDNet/COVID19_3.html
6 https://covid.cdc.gov/covid-data-tracker/#trends_dailytrends
8 https://apnews.com/hub/election-2020
21
Returns are based on the S&P 500 Total Return Index, an unmanaged, capitalization-weighted index that measures the performance of 500 large capitalization domestic stocks representing all major industries. Indices do not include fees or operating expenses and are not available for actual investment. The hypothetical performance calculations are shown for illustrative purposes only and are not meant to be representative of actual results while investing over the time periods shown. The hypothetical performance calculations for the respective strategies are shown gross of fees. If fees were included returns would be lower. Hypothetical performance returns reflect the reinvestment of all dividends. The hypothetical performance results have certain inherent limitations. Unlike an actual performance record, they do not reflect actual trading, liquidity constraints, fees and other costs. Also, since the trades have not actually been executed, the results may have under- or overcompensated for the impact of certain market factors such as lack of liquidity. Simulated trading programs in general are also subject to the fact that they are designed with the benefit of hindsight. Returns will fluctuate and an investment upon redemption may be worth more or less than its original value. Past performance is not indicative of future returns. An individual cannot invest directly in an index.
This material has been prepared for information and educational purposes and should not be construed as a solicitation for the purchase or sell of any investment. The content is developed from sources believed to be reliable. This information is not intended to be investment, legal or tax advice. Investing involves risk, including the loss of principal. No investment strategy can guarantee a profit or protect against loss in a period of declining values. Investment advisory services offered by duly registered individuals on behalf of ChangePath, LLC a Registered Investment Adviser.

"As of October 1st, the Federal Reserve Bank of Atlanta predicts a 34.6% increase for the third quarter.3"
"U.S. growth stocks have outperformed this year despite the negative news because of the large shift to eCommerce and the flight to quality."
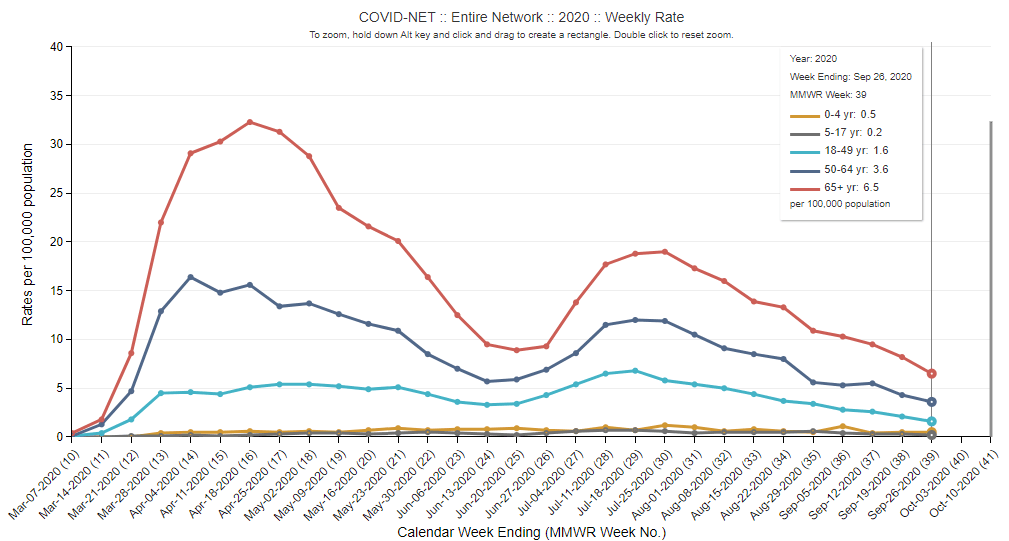
Source (5)

Source (6)

Source (8)
"Biden's tax plan would... increase the top ordinary income tax rate back to 39.6% - it is currently at 37%"
"At the end of the day, we simply do not know how the election will unfold, but what we do know is that an election will produce more political certainty."


P:
888.798.2360 F:
913.661.1183
6330 Sprint Pkwy Suite 400, Overland Park, KS 66211
Disclosure: Continuity planning offered through CreativeOne Wealth, LLC and CreativeOne Securities, LLC. CreativeOne Wealth, LLC. advisory services offered through CreativeOne Wealth, LLC, a Registered Investment Adviser. CreativeOne Securities, LLC. Member FINRA/SIPC and an Investment Advisor.
Privacy Policy | ADV Part 2A | Form CRS
© 2023 Creative One Marketing Corporation, CreativeOne Wealth, LLC and CreativeOne Securities, LLC.