Market Commentary | August 2020
THE MARKET
Once again, the S&P 500 continued its rise this summer by finishing the month of August up 7.19%.
The index is now up 9.74% on the year, which pushed it above it’s previous high from February 19th. The Dow Jones Industrial Average has also creeped into positive territory on the year as it is now up 1.30% in 2020 after an increase of 7.92% during the month of August. And not to be outdone, the NASDAQ continued its strong 2020 with a 9.70% increase in August leading to a 32.07% increase on the year.1

Source (2)
The main contributors to the positive performance focus on the central theme of 2020, Covid-19. As the graph shows below, daily cases have continued to decrease throughout August and daily deaths have begun to plateau.
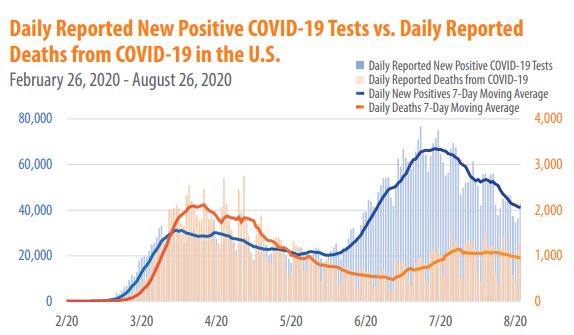
Source (3)
Along with positive news on the number of cases and deaths, there seems to be optimism on the vaccine front. The vaccine being developed by Oxford University and AstraZeneca has started phase-3 of clinical trials in the United States, and there are reports that the United States may be moving towards getting an early vaccine, even before the entirety of the phase-3 trials is complete.4 According to Dr. Anthony Fauci, clinical trials of a COVID-19 vaccine can be legitimately cut short and could allow a vaccine to become available more quickly than previously expected.5 As we’ve discussed before, the market tends to price things in rather quickly, and we believe that the large uptick in the month of August indicates that investors believe the positive news coming out regarding a vaccine.
While the number of cases declining and the positivity surrounding a potential vaccine were large parts of the monthly market performance, there were other contributors as well. The second quarter earnings season has officially ended, and results were generally better than expected, albeit still poor. The S&P 500 Index companies reported an earnings per share decline of 31.8% for the quarter, in what was the largest year-over-year decline since the first quarter of 2009. Despite the poor near term results, investors responded positively to future guidance along with the record 84% of companies that have reported positive earnings surprises. The forward 12-month P/E ratio for the S&P 500 is now 22.8, well above both the 5- and 10-year average which has historically been right around 15.2

Source (6)
The P/E ratio, or price-to-earnings ratio, is an important metric because it shows how much investors are willing to pay in order to participate in a company’s earnings. Broadly speaking, the P/E ratio is the dollar amount that an investor can expect to invest in a company in order to receive one dollar of that company’s earnings. With 22.8 being the current P/E ratio of the S&P 500, we are looking at a double-edged sword. On one hand, a higher P/E ratio indicates that investors are willing to pay a higher share price today because of growth expectations in the future. However, on the other hand, a higher P/E ratio could indicate that a stock is overvalued as investors are paying too high of a price per dollar of that company’s earnings. Said differently, a low P/E ratio could either indicate that a stock has good value, or that investors don’t feel confident about a company’s future prospects.

Source (7)
While one can interpret the higher than average P/E ratio of the S&P 500 either way that they see fit, we view it as an opportunity to emphasize why having a disciplined and diversified investment approach is more relevant now than ever. Could the future growth potential of the companies leading the S&P 500 like Amazon, Google, and Microsoft, indicate that the current P/E ratio of the index is fair? It’s very possible. Its also possible that the market could be overvalued. As we discussed above, the market prices things in rather quickly, and sometimes before they happen.

Source (8)
The citizens of the United States will likely receive another stimulus package from the government sometime soon. As you may recall, the market increased significantly after the stimulus package during the 2007-2009 Financial Crisis even though it took some time.9 More recently, the market rebounded much quicker after the first major coronavirus relief package was passed earlier this year.10 While we don’t believe that another stimulus package will be agreed upon until after the election, we do think one is imminent, and we believe that the market feels the same way leading to the new highs set in August.
Circling back to our reasoning as to why being invested in a diversified portfolio makes sense, we look no further than the somewhat contradictory statements released by Deloitte and Goldman Sachs. According to a recent Deloitte survey, a stunning 84% of Fortune 500 CFOs say the US stock market is overvalued. That's up from the 55% who felt that way a quarter ago. Just 2% of finance chiefs say US stocks are undervalued. The findings add to the mounting evidence suggesting the slingshot rise in stocks created in part by the Federal Reserve may be overdone. Even as elevated levels of unemployment show that the real economy is still suffering from the pandemic, the S&P 500 has skyrocketed 55% since its March 23 lows.11 On the other hand, Goldman Sachs became the latest firm to increase its price target for the S&P 500, boosting its year-end target by 20%, from 3000 to 3600. The economy, they say, will rise much faster than the market expects next year, driven by the firm’s expectation of a coronavirus vaccine approved by the end of 2020 and widely distributed by the first half of 2021.12 To put this into context, the S&P 500 closed at 3,500 on August 31st.1 So, Goldman Sachs see a potential 2.8% gain through the end of the year, while many of the S&P 500 company’s CFOs believe that the market is overvalued. Also, for the first time in a decade, those same CFOs are more bullish on the Chinese economy than they are on North America’s.11 To add on to that, the P/E ratio for global equity markets as of 6/30/2020 was 19.63. That is lower than the 30-year average which might indicate that global equity markets are underpriced.13
CONCLUSION
While neither you nor I can predict which way the stock market will go, we do know that investing for the long term is a sound choice. However, we can’t guess which asset class is going to be on top one year and at the bottom the next year. To bring everything full circle, most of the comments above pertained to U.S. Large Cap equities. Are they overvalued? Have they peaked for 2020? What upside do they have for the remainder of the year? We simply don’t know, and it’s very possible that the next stimulus package could raise the index’s floor even higher. Possibly to the point where companies like Goldman Sachs increase their yearend estimates once again. On the other hand, many of the CFOs for those companies in the index seem to think China has more growth potential in the near term than the U.S. There has been a flight to quality this year amid the pandemic scare which is why the S&P 500 is setting records despite poor economic data. However, this has also led to potential opportunities in the other sub asset classes both domestically and internationally. We believe this is evidence as to why it is important to maintain a well-diversified portfolio relative to your risk tolerance with exposure to all asset classes. We will leave you with the image below, which shows how asset classes have performed both in the last few months and in the last few years. As you can see, what is leading the race one year, may easily be at the bottom the next year. The same can be said month over month, and that is why it is important to maintain the disciplined approach while not trying to time the market.

Source (14)
1 https://www.investing.com/indices/
2 https://www.massmutual.com/mmfunds/monthly_market_overview.pdf
10 https://www.nytimes.com/2020/04/29/business/stock-markets.html
11 https://www.cnn.com/2020/08/27/investing/stock-market-overvalued-deloitte-cfo/index.html
13 https://siblisresearch.com/data/global-markets-pe/
14 https://www.callan.com/wp-content/uploads/2020/08/Callan-July-2020-Monthly-Periodic-Table.pdf
21
Returns are based on the S&P 500 Total Return Index, an unmanaged, capitalization-weighted index that measures the performance of 500 large capitalization domestic stocks representing all major industries. Indices do not include fees or operating expenses and are not available for actual investment. The hypothetical performance calculations are shown for illustrative purposes only and are not meant to be representative of actual results while investing over the time periods shown. The hypothetical performance calculations for the respective strategies are shown gross of fees. If fees were included returns would be lower. Hypothetical performance returns reflect the reinvestment of all dividends. The hypothetical performance results have certain inherent limitations. Unlike an actual performance record, they do not reflect actual trading, liquidity constraints, fees and other costs. Also, since the trades have not actually been executed, the results may have under- or overcompensated for the impact of certain market factors such as lack of liquidity. Simulated trading programs in general are also subject to the fact that they are designed with the benefit of hindsight. Returns will fluctuate and an investment upon redemption may be worth more or less than its original value. Past performance is not indicative of future returns. An individual cannot invest directly in an index.
This material has been prepared for information and educational purposes and should not be construed as a solicitation for the purchase or sell of any investment. The content is developed from sources believed to be reliable. This information is not intended to be investment, legal or tax advice. Investing involves risk, including the loss of principal. No investment strategy can guarantee a profit or protect against loss in a period of declining values. Investment advisory services offered by duly registered individuals on behalf of ChangePath, LLC a Registered Investment Adviser.


P:
888.798.2360 F:
913.661.1183
6330 Sprint Pkwy Suite 400, Overland Park, KS 66211
Disclosure: Continuity planning offered through CreativeOne Wealth, LLC and CreativeOne Securities, LLC. CreativeOne Wealth, LLC. advisory services offered through CreativeOne Wealth, LLC, a Registered Investment Adviser. CreativeOne Securities, LLC. Member FINRA/SIPC and an Investment Advisor.
Privacy Policy | ADV Part 2A | Form CRS
© 2023 Creative One Marketing Corporation, CreativeOne Wealth, LLC and CreativeOne Securities, LLC.