Blog Layout
Market Commentary | September 2019
Rob Kellogg, CFA® • Oct 05, 2019
THE MARKET
The S&P finished off a mediocre third quarter by increasing 1.72% in September, gaining back nearly all of the 1.81% that it lost in August.
A similar scenario occurred for the DJIA as it was up 1.95% for the month of September coming after a 1.72% loss in August. The NASDAQ didn’t fare quite as well relative to its August performance as it was up 0.46% in September following its 2.60% loss in August. The broader exciting news is that the S&P 500 is up 19% through the first three quarters this year. This is the best start to a calendar year for the S&P 500 since 1997.1
Asset Class Performance and the Callan Chart
While the S&P 500 is enjoying a very solid year thus far, most equity portfolios and asset allocation portfolios are slightly underperforming the index. ChangePath’s models are up anywhere from 8% to 12% through the first three quarters depending on the risk tolerance. We want to stress the importance of asset allocation and diversification. As we experience volatility, and the fear of a market downturn in the latter part of 2019, a diversified asset allocation portfolio will provide more downside protection than investing in the index. Why? To illustrate, especially as we near the end of a market cycle and recession fears loom, let’s reference the below image.
The above image is called a Callan Chart. It is often referenced as the Periodic Table of Investment Returns. Each color represents a different asset class and you can see how they performed year over year. The quick takeaways from the graph are the returns, and more importantly, the volatility associated with each asset class. For example, in 2006, REITs are the best performing asset class and the next year they are the worst. In 2007, emerging market (EM) equity was the best performing asset class, in 2008 it was the worst, then in 2009 it was the best again only to once again be the worst in 2011. To help identify the value of a diversified asset allocation portfolio, please take a look at the white boxes connected by black line. The white boxes represent an annually rebalanced asset allocation portfolio that is never better than the third best performing asset class and never worse than sixth. A diversified portfolio is meant to smooth out the ups and downs of the market, avoiding the results REITs experienced in 2007 and EM equity in 2008. Winning isn’t the most important metric to focus on. Often times it is losing, which is why a diversified asset allocation portfolio, suited to your risk tolerance, is essential to a successful investment strategy.
The S&P 500 Index
We’ve established that asset allocation portfolios have lagged the S&P 500 this year. Many investors may be questioning why they aren’t achieving the same returns as the S&P 500 this year and quite frankly, every year since 2012. But why is that?
Stock indexes are great tools because they allow us to see a thousand-foot view of what the market is doing as a whole. There are small cap indexes, large cap indexes, international indexes, and many other indexes that can help investors get a big picture view of what is happening in a certain style or sector. Most investors use the S&P 500 to get a sense of the entire market and often compare their own portfolios to the index. However, because of the way that the S&P 500 is constructed, we aren’t getting the best view of the entire market. We are mainly looking at how the largest stocks have performed.
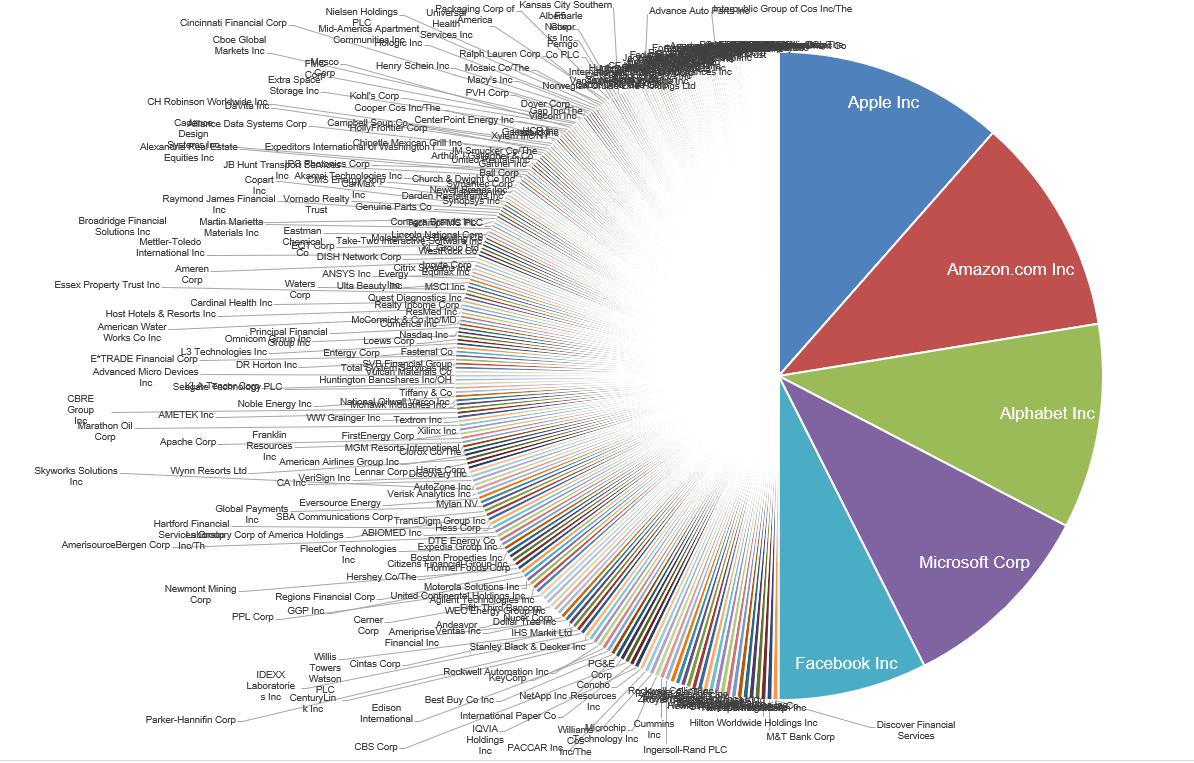
The S&P 500 is a market-cap weighted index. What that means is that the larger the market cap of a company, the more impact is has on the index. The chart above shows the effect that the five largest companies in the index have on its performance. The companies are Apple, Amazon, Alphabet (Google), zMicrosoft, and Facebook, which have all performed very well since the financial crisis. As you can see, Microsoft (MSFT) is currently one of the largest stocks in the index. It is up over 370% since the start of 2012. Fossil Group (FOSL) is one of the smallest stocks in the index. It is down over 80% since the beginning of 2012.4
When MSFT makes a big move, it greatly impacts the index, and when FOSL makes a move, it hardly effects the index. Essentially, the S&P 500 is moved by large cap equities.5
To bring it back full circle, let’s look at the previously shown Callan Chart once again.
As you can see, this time there is a line drawn to separate 2008 and 2009. Once again, the white box represents an asset allocation portfolio. The light green box represents large cap companies. Prior to 2008, notice the large cap performance is fairly even with the asset allocation portfolio performance. This is to be expected and what many analysts believe to be normal. Since 2009, large cap equity has always outperformed asset allocation and by a decent amount. At some point, this should normalize and look closer to levels prior to 2009. This is comparable to the performance between the S&P 500 (large cap) and your ChangePath portfolios (asset allocation). While your portfolios may have slightly underperformed the S&P 500 over the last few years, at some point it will normalize, and asset allocation will outperform. If you are wary of a recession, look at 2007 and 2008. The asset allocation portfolios greatly outperformed large cap.
All of this is to say that it is important to stay disciplined and invest according to your risk tolerance with the correct asset allocation. You shouldn’t try to time the market with sectors and styles as evidenced by the variance in asset class performance shown in the Callan Chart. You also shouldn’t compare your portfolio’s performance to the S&P 500 as it is not an accurate comparison. Some years you will outperform the index and others you will not. The asset allocation portfolio incorporates the various asset classes and highlights that balance and diversification can help reduce volatility and enhance returns.2
CURRENT EVENTS UPDATE
There are quite a few current events that occurred in September. Keep in mind that most of these events lead to some sort of turmoil in the market. Some are temporary like the sharp increase in the price of oil due to the attack in Saudi Arabia, and some have more lasting effects like the outcome of Brexit. Immediate market reactions to these events are no cause for alarm unless there is some sort of weakening in the fundamentals of the economy that pairs with one of these shock events for a perfect storm. Examples include the weakening economy in 1999-2000 followed by the terrorist attack on 9/11 and the weakening economy in 2006 followed by the subprime mortgage crisis and the collapse of Lehman Brothers. We will go more in depth in these as they continue to unfold.
- US-China Trade Negotiations: The two sides are scheduled to meet in “early October” to continue discussions in hopes for a partial deal, and the Trump Administration continues to make threats regarding Chinese investments.
- Brexit: Boris Johnson continues to promise Brexit by Halloween, but no ground has been gained.
- Oil Prices: The mid-September attack on the Saudi Arabian oil field caused quite the spike in prices, but those prices have sense normalized. The tension in the Middle East will need to be monitored.
- IPOs: There seems to be a lot of optimism around companies that aren’t making any money (see WeWork). It has been compared to the “dot com” bubble and there is a slight reason for concern.
- Repo Market: The first injection of cash into the banking sector occurred since the financial crisis as the Fed injected $75 billion a day in temporary cash over a four-day period in mid-September. This was caused because cash was flowing out just as securities were flowing in. A repurchase agreement is a form of short-term borrowing, mainly in government securities. The dealer sells the underlying security to investors and buys them back shortly afterwards, usually the following day, at a slightly higher price determined by the repo rate. On September 17th, the repo rate jumped to 10% which was up from 2% the week prior. This rate volatility caused the effective federal funds rate to increase to 2.30%, which is above the 2.25% upper limit of the Fed’s target range. This occurred as the Fed was preparing to drop the upper limit to 2%.7
- US Politics: Nancy Pelosi announced a formal impeachment inquiry of President Trump on Tuesday, September 24th.8 Traditionally, although with a small sample size, the impeachment inquiry should not have a long-term effect on the markets as Vice President Pence’s policies aren’t likely to be too different than Trump’s. Longer term effects could occur related to Trump’s possible re-election though as Elizabeth Warren or Joe Biden are likely to have vastly different policies.
OCTOBER UPDATE
As of the publication of this commentary on October 3rd, the S&P 500 is off to its worst start ever in a fourth quarter since the 2008-2009 financial crisis. Through the first two days of October, the S&P 500 is down 3.20%.1
That is its worst mark since being down 5.49% to start off October of 2009.9
This will quickly remind investors of the painful fourth quarter in 2018 that saw the S&P 500 drop over 13%.1
There is evidence of an economic slowdown, worries about Brexit, impeachment inquiries in the United States, and on-going global issues with the US-China trade talks and the Saudi Arabia oil field attacks. These events have all contributed to the recession fears that have creeped into the market rather quickly. While these signs may cause an investor to panic and run for safety or exit the markets, it is still wise to maintain a disciplined investment approach. We caution investors trying to time the market downturn, and in August’s commentary we stressed that there would be increasing volatility throughout the remainder of 2019. However, there is reason for optimism. The probability of a rate cut by the Fed is increasing, and over the last decade, the fourth quarter has been the quarter with the highest average returns. Excluding 2018, the S&P 500 has averaged over a 4% gain in the fourth quarter over the last decade and traded positively in the fourth quarter eight out of the ten years.10
There is uncertainty and the recession risk is real, but we aren’t predicting anything close to the selloff that occurred in the fourth quarter of 2018. As we approach the end of 2019, it is vital that you consult your advisors, confirm your risk tolerance, and stick to the plan created in your annual review. As shown above in the Callan Chart, the correct asset allocation portfolio with balance and diversification can help absorb the shock of volatility.
3 Seeking Alpha, July 23, 2018
*Returns are based on the S&P 500 Total Return Index, an unmanaged, capitalization-weighted index that measures the performance of 500 large capitalization domestic stocks representing all major industries. Indices do not include fees or operating expenses and are not available for actual investment. The hypothetical performance calculations are shown for illustrative purposes only and are not meant to be representative of actual results while investing over the time periods shown. The hypothetical performance calculations for the respective strategies are shown gross of fees. If fees were included returns would be lower. Hypothetical performance returns reflect the reinvestment of all dividends. The hypothetical performance results have certain inherent limitations. Unlike an actual performance record, they do not reflect actual trading, liquidity constraints, fees and other costs. Also, since the trades have not actually been executed, the results may have under- or overcompensated for the impact of certain market factors such as lack of liquidity. Simulated trading programs in general are also subject to the fact that they are designed with the benefit of hindsight. Returns will fluctuate and an investment upon redemption may be worth more or less than its original value. Past performance is not indicative of future returns. An individual cannot invest directly in an index. Data as of December 29, 2017.
Investment advisory services offered by duly registered person on behalf of ChangePath, LLC, a registered investment advisor. Please consult your investment adviser representative for investment advice tailored to your individual circumstances; the material presented herein is of a general nature and for informational purposes only.

Source (2)
Source (3)

Source (2)
"The first injection of cash into the banking sector occurred since the financial crisis as the Fed injected $75 billion a day in temporary cash over a four-day period in mid-September."
"There is evidence of an economic slowdown, worries about Brexit, impeachment inquiries in the United States, and on-going global issues with the US-China trade talks and the Saudi Arabia oil field attacks."
This is a subtitle for your new post

The body content of your post goes here. To edit this text, click on it and delete this default text and start typing your own or paste your own from a different source.

November was a dizzying month for investors. The highlight? Earnings. 82% of companies1 beat estimates this quarter, despite headwinds such as supply chain constraints and inflation. The market’s biggest muse? Elon Musk’s twitter handle, with tweets such as (paraphrased) “should I sell 10% of my Tesla stock?” The most exciting job? Fed watcher. We started tapering, saw a plethora of hot inflation data, and gleaned insight from Federal Reserve Chair Jerome Powell on the last day of the month. November 2021 Market Returns

October was another positive month for the markets after September’s pullback. So far in 2021, the S&P 500 had nine positive performing months, September being the only hold out. The index ended up 6.9%, even though the first week of the month started a bit volatile. However, 2021 is looking robust, even if November and December aren’t large contributors, as the YTD performance through October is 23.9%. 1

September ended the streak of seven positive months in a row for the S&P 500 as it was the first negative month for the index since January of this year. The index ended the month down 4.76%, but it is still up nearly 15% on the year. That is the worst monthly decline for the index since March of 2020 when it fell 12.51%. 1

August was one of the year’s best months for the investors as the S&P 500, the Dow Jones Industrial Average (DJIA), and the NASDAQ Composite each hit new all-time highs. It is the seventh straight month of increases for the S&P 500 as it finished the month up 2.90%, and the index is now up 20.41% for the year. 1 Coming in alongside market highs was earnings growth as 98% of companies in the S&P 500 have now reported for the second quarter. Earnings were expected to be higher this year relative to the lower levels caused by the virus in 2020 as estimates for second quarter earnings growth came in at 63%. However, with almost all companies having reported, earnings growth significantly outperformed expectations as it came in at 89% helping the market reach new highs. 2

The S&P 500 continued to climb for the fifth straight month as the index hit a new all-time high on July 29 th . 1 The index finished the month up 2.27% and is now up 17.02% on the year. The Dow Jones Industrial Average (DJIA) and the NASDAQ Composite both increased during the month as well finishing up 1.26% and 1.20% respectively. Both indices are now comfortably in double digit returns for the year. Small cap stocks took a significant hit as the Russell 2000 fell 3.65% during the month, but it is still up 12.73% on the year. As investors move some of their equity gains into fixed income and the Fed continues with their asset purchases, bond demand has increased leading to a return of 1.12% for the U.S. Agg in the month of July. It is now down just 0.50% on the year. 2

The S&P 500 Index continues to climb in June as it finished the month up 2.22% leading to a 14.41% increase on the year. The technology heavy NASDAQ led the way during the second quarter as it was up 9.50% on the quarter following a strong June, and it is now up 12.50% on the year. The Dow Jones Industrial Average (DJIA) did not follow suit during the month of June as it was down 0.08%, but the index is still up nearly 13% on the year. 1

Equities fell on the last trading day of April as investors likely took their share of profits after positive news regarding corporate earnings and economic data. However, the major U.S. indices still finished in positive territory for the third straight month as the S&P 500 has hit 25 record highs thus far in 2021. 1

The markets started off strong in May before running into inflation fears towards the middle of the month. After those fears were somewhat curbed by the Fed, markets rallied to end the month. The S&P 500 index is up nearly 12% on the year after it finished the month of May up 0.55%. This is the fourth positive month in a row for the index after it finished down just over 1% in January. The Dow Jones Industrial Average (DJIA) finished the month up nearly 2% and is now up 12.82% on the year. The technology heavy NASDAQ did not fair as well during the month as it declined 1.53% and is now up 6.68% on the year. Small cap stocks were relatively flat for the month as the Russell 2000 finished up 0.11%. The MSCI EAFE and EM indices both finished in positive territory as well. 1 As we enter the summer months, June has traditionally been a weak month for markets as the DJIA is averaging 0.12% over the last 50 years, and it is down an average of 0.7% over the last 20 years. However, July and August are traditionally good months for the index as it averages an increase of 3% over its 125-year history. 2

After a volatile month, the S&P 500 finished at a record high when the markets closed on March 31 st . The index finished the month up 4.24% and is now up 5.77% on the year. As the economic recovery continues, the Dow Jones Industrial Average led the monthly performance numbers as it finished up 6.62% and is now up 7.76% on the year. The technology heavy NASDAQ finished the month in positive territory, but it continues to lag the other two indices after outperforming both in 2020. The index finished the month up 0.41% and is now up 2.78% on the year. Small cap stocks continued to inch higher as the Russell 2000 ended the month up 0.88% and is now up 12.44% on the year. The MSCI EAFE index is up just under 3% on the year after a positive month, however the MSCI Emerging Markets index fell 1.70% during the month and is now up 1.95% on the year. The Bloomberg Barclay’s U.S. Aggregate Bond index fell 1.25% in March and is now down 3.37% on the year. 1

Equity markets were modestly higher in the month of February after January saw both the S&P 500 and Dow Jones Industrial Average (DJIA) in negative territory.
P:
888.798.2360 F:
913.661.1183
6330 Sprint Pkwy Suite 400, Overland Park, KS 66211
Disclosure: Continuity planning offered through CreativeOne Wealth, LLC and CreativeOne Securities, LLC. CreativeOne Wealth, LLC. advisory services offered through CreativeOne Wealth, LLC, a Registered Investment Adviser. CreativeOne Securities, LLC. Member FINRA/SIPC and an Investment Advisor.
Privacy Policy | ADV Part 2A | Form CRS
© 2023 Creative One Marketing Corporation, CreativeOne Wealth, LLC and CreativeOne Securities, LLC.