Blog Layout
Market Commentary | August 2019
Rob Kellogg, CFA® • Sep 05, 2019
THE MARKET
After the S&P 500 hit a new all-time high during the month of July, it had its worst week of the year to start off August, and this was only a sign of the volatility to come.
The VIX (CBOE Volatility Index), a popular measure of the stock market’s expectation of volatility, averaged 19 for the month of August, up from an average of 13 in July.1
The higher the average, the more expected volatility. Last month, the Federal Reserve issued a 25-basis point rate cut on the last day of July but seemed to be unsure about the possibility of future rate cuts this year.2
On the first day of August, United States President Donald Trump announced additional tariffs on Chinese goods. The combination of interest rate uncertainty and trade relationship volatility caused a negative 3.07% return for the S&P 500 for the week ending on August 2nd. That was the worst weekly performance for the index since December of 2018. To follow that up, Monday, August 5th, was the worst performing day for the S&P 500 in 2019 as it dropped 2.98%.3
This was mostly due to the escalation in the US-China trade war as China is believed to have allowed its currency to devalue.4
The remainder of August experienced additional volatility with continued back and forth in the trade war between the United States and China, uncertainty regarding Great Britain and a possible no-deal Brexit, and an inverted yield curve.
In spite of the turmoil, the US saw strong company earnings, a positive sign for the economy. The conflict between the previously mentioned shaky situations and the strong company earnings created a choppy market and led to a 2.5% daily drop in the S&P 500 three separate times during the month of August.
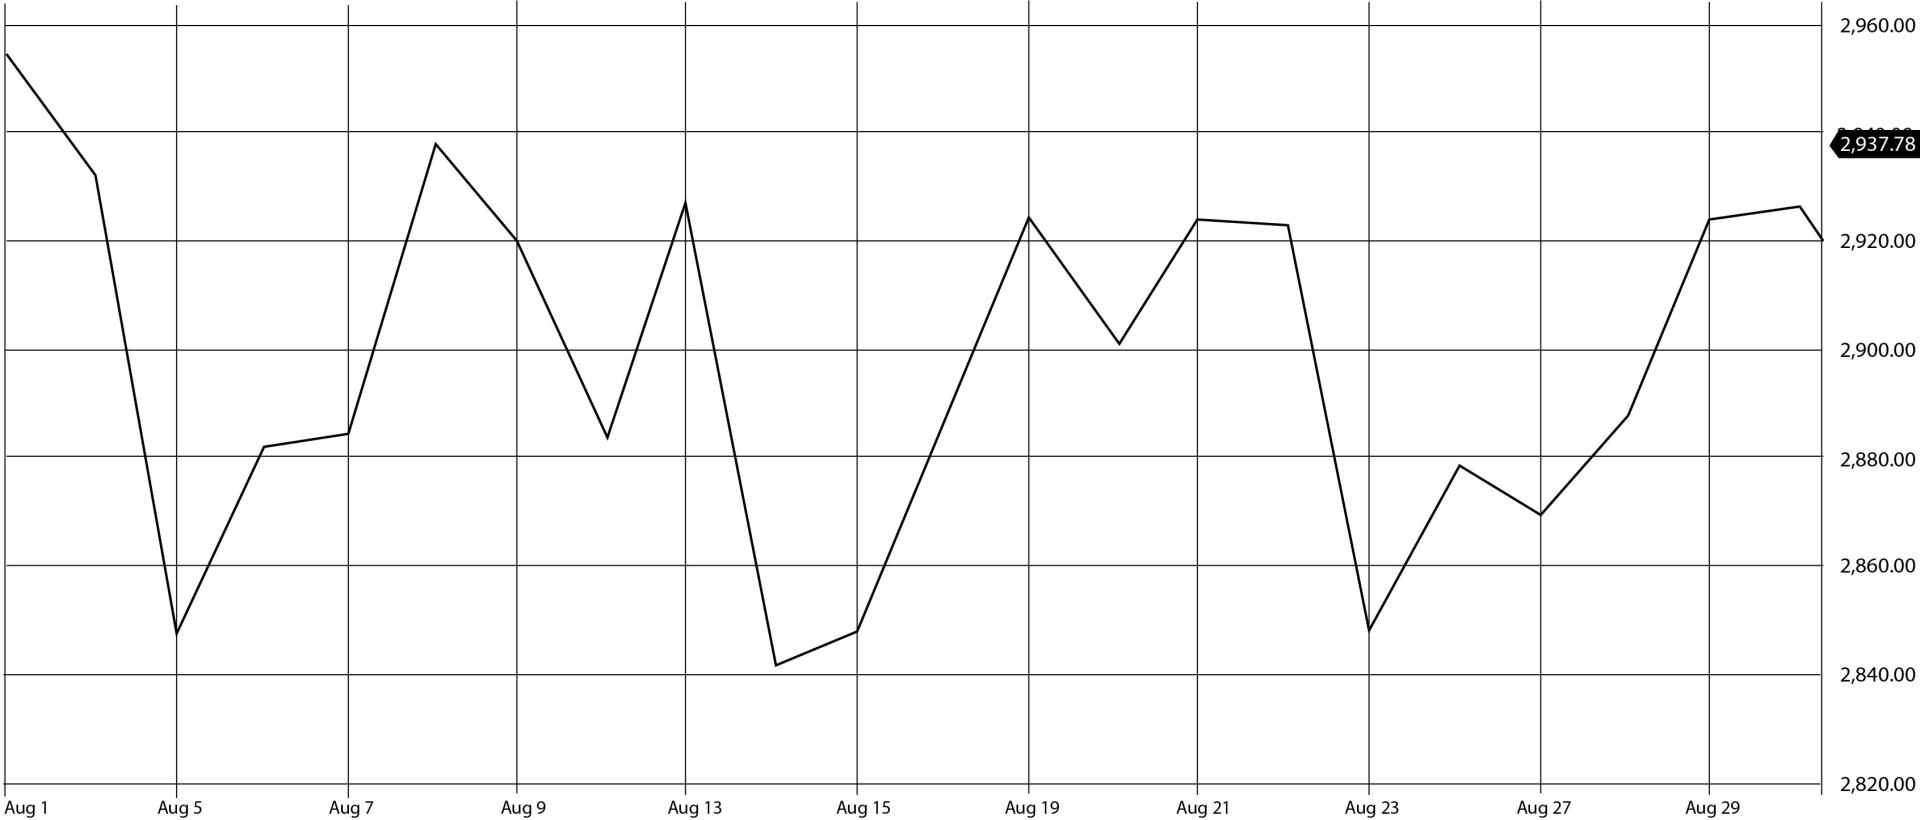
As you can see in the graph below, the S&P 500 reached its monthly trough in the middle of August but has since rebounded culminating with a 2.79% return during the last week of the month. The index closed August down 1.81%. The NASDAQ finished down 2.01% and the DJIA finished down 1.72%.3
IN INTERNATIONAL WARS
US-China Trade War
The 2.79% rebound for the S&P 500 during the last week of August was in part due to the slightly calmer tone surrounding the US-China trade war. US-China relationships have been a rollercoaster throughout the month of August. Here a few highlights from the month.
- August 1st, Trump claims the United States will impose 10% tariffs on another $300 billion of Chinese goods starting on September 1st.
- August 5th, China’s currency, the yuan, sinks to its lowest level against the US dollar in 11 years causing markets to tumble. The United States claims that China allowed this to happen in order to gain an unfair advantage in international trade. China refutes the claim and then proceeds to suspend purchases of new US agricultural products.
- August 13th, the two sides agree to talk again in two weeks.
- August 23rd, China announces new tariffs on US goods.
- Finally, on August 26th, China’s top trade negotiator calls for calmness in the trade war as he firmly opposed the escalations, to which President Trump agreed.
The US tariffs on Chinese goods are still set to be enforced on September 1st and it’s unlikely that this will all be resolved anytime soon.6
What did this mean for investors? Simply put, it meant volatility. There is still uncertainty in the relationship, and it is likely that talks continue, however, it does not appear that the trade issues will be resolved anytime soon. It is important to note that any announcement, good or bad, when dealing with the trade war can trigger volatility in the markets, but we want to stress the importance of staying the course for now and maintaining your disciplined investment approach.
Brexit
In July, Boris Johnson, Prime Minister of Great Britain, stated that a Brexit deal would be reached “do or die” by the October 31st deadline, otherwise a “no-deal Brexit” was possible. As a deal seemed more unlikely throughout the month, Johnson took matters into his own hands.
Britain is scheduled to leave the European Union on October 31st but has yet to reach a withdrawal agreement which would soften the blow of their departure for both sides. It seemed likely that United Kingdom lawmakers would once again try to delay Brexit if a deal could not be reached. They have been trying for months to design laws that would both make a “no deal Brexit” impossible, but also ones that enable a deal and are helpful to all parties involved.
To bypass another snag, Boris wanted to prevent lawmakers from making laws that would force another delay or a cancellation of Brexit. He asked the Queen to “prorogue” parliament, or formally end the current session, to which she agreed. Essentially what this means is that lawmakers will have less time to legislate against a “no deal Brexit”.
Lawmakers have been on summer break since July 25th, one day after Boris Johnson became Prime Minister, and they are due back on September 3rd. They were then set to meet until September 14th, and during that time would try to legislate against a “no deal Brexit”. After Johnson’s latest move, parliament will now be suspended as early as September 9th which gives UK lawmakers less time to prevent the said “no deal Brexit” occurring.7
One thing is certain, the first week of September is likely to be eventful for Boris and Great Britain. There is still time and there are still options to prevent a “no deal Brexit”, but Prime Minister Johnson has put quite a bit more pressure on lawmakers to make decisions during the early days of September.
INVERTED YIELD CURVE?
If you’ve tuned into the news lately, I’m sure you’ve heard the term “inverted yield curve” and that it can be a potential precursor to a recession. But what is it exactly?
A yield curve is a line that plots the interest rates (yields), at a set point in time, of bonds that have equal credit quality but different maturity dates. The most commonly used are US Treasury debt at 3-month, 2-year, 5-year, 10-year, and 30-year maturities. The curve plotted by these instruments is used as a benchmark for things like bank lending rates and mortgages. Normally, it resembles something like the blue line in the image below.
Short-term debt is shown having a lower yield than longer-term debt of the same credit quality. This means that you are getting paid more to lend your money for a longer period of time. The reason you are paid more is called a maturity risk premium because changes in the value of longer-term securities are more unpredictable. When the outlook of the economy and stock markets is positive, the yield curve is usually normal.
However, when investors expect longer-term bond yields to fall, they will purchase them in order to lock in those yields before they further decrease. Thus, driving the yields down even more and causing a yield curve inversion, shown by the red line in the image above. We recently experienced a yield curve inversion in August, which meant consumers were lending money for a longer period of time at a lesser rate due to such high demand for longer term bonds. An inverted yield curve can be a source of concern for a variety of reasons: short-term rates could be running high because overly tight monetary policy is slowing the economy, or it could be that investor worries about future economic growth are stoking demand for safe, long-term Treasurys, pushing down long-term rates. Why is this important? An inverted yield curve of the 2-year and 10-year treasuries has preceded the last seven recessions.9 This doesn’t mean a recession is coming soon or that it is certain to happen, but it is something to keep an eye on as it is one of the leading indicators to a possible economic downturn.
MAINTAIN A DISCPLINED APPROACH WITH YOUR PORTFOLIO
As we discussed after the month of July, volatility was bound to continue throughout the month of August.
With all the uncertainty regarding interest rates, Brexit, and the trade war between the United States and China, we stressed the importance of maintaining a disciplined investment approach. We encouraged you to maintain the asset allocation set forth by your risk tolerance questionnaire.
It’s easy to look back on a month like August and wish you would’ve been on the sidelines during some days or that you tried to time the market and exit as it was going down. It sounds simple enough, but market timing isn’t just about selling. It requires two decisions: when to sell, and when to buy back in.
As previously mentioned at the beginning of this piece, the S&P 500 experienced a daily drop of 2.5% on three difference occasions in August. However, had you decided to exit the market after those days, you likely would have been a disappointed investor. The three days when the 2.5% drop occurred were August 5th, August 14th, and August 23rd (note: each of these days coincided with announcements in the US-China trade talks mentioned above). The 2.5% drop was gained back within 3 business days each time.3 Had you exited immediately after the daily drop; you would have missed the recovery that came shortly after.
We had an idea that the volatility would continue in August, and it’s smart to expect these market ebbs and flows to occur, but rather than try to time the ups and downs, we need to manage them with a disciplined asset allocation approach to investing.
1 https://www.cboe.com/index/dashboard/VIX#vix-performance
*Returns are based on the S&P 500 Total Return Index, an unmanaged, capitalization-weighted index that measures the performance of 500 large capitalization domestic stocks representing all major industries. Indices do not include fees or operating expenses and are not available for actual investment. The hypothetical performance calculations are shown for illustrative purposes only and are not meant to be representative of actual results while investing over the time periods shown. The hypothetical performance calculations for the respective strategies are shown gross of fees. If fees were included returns would be lower. Hypothetical performance returns reflect the reinvestment of all dividends. The hypothetical performance results have certain inherent limitations. Unlike an actual performance record, they do not reflect actual trading, liquidity constraints, fees and other costs. Also, since the trades have not actually been executed, the results may have under- or overcompensated for the impact of certain market factors such as lack of liquidity. Simulated trading programs in general are also subject to the fact that they are designed with the benefit of hindsight. Returns will fluctuate and an investment upon redemption may be worth more or less than its original value. Past performance is not indicative of future returns. An individual cannot invest directly in an index. Data as of December 29, 2017.
Advisory services offered through ChangePath, LLC a Registered Investment Adviser. Please consult your investment adviser representative for investment advice tailored to your individual circumstances; the material presented herein is of a general nature and for informational purposes only.
The body content of your post goes here. To edit this text, click on it and delete this default text and start typing your own or paste your own from a different source.
"Trump claims the United States will impose 10% tariffs on another $300 billion of Chinese goods starting on September 1st."
"Boris asked the Queen to “prorogue” parliament, or formally end the current session, to which she agreed. Essentially what this means is that lawmakers will have less time to legislate against a “no deal Brexit”.

"It sounds simple enough, but market timing isn’t just about selling. It requires two decisions: when to sell, and when to buy back in. ”.

November was a dizzying month for investors. The highlight? Earnings. 82% of companies1 beat estimates this quarter, despite headwinds such as supply chain constraints and inflation. The market’s biggest muse? Elon Musk’s twitter handle, with tweets such as (paraphrased) “should I sell 10% of my Tesla stock?” The most exciting job? Fed watcher. We started tapering, saw a plethora of hot inflation data, and gleaned insight from Federal Reserve Chair Jerome Powell on the last day of the month. November 2021 Market Returns

October was another positive month for the markets after September’s pullback. So far in 2021, the S&P 500 had nine positive performing months, September being the only hold out. The index ended up 6.9%, even though the first week of the month started a bit volatile. However, 2021 is looking robust, even if November and December aren’t large contributors, as the YTD performance through October is 23.9%. 1

September ended the streak of seven positive months in a row for the S&P 500 as it was the first negative month for the index since January of this year. The index ended the month down 4.76%, but it is still up nearly 15% on the year. That is the worst monthly decline for the index since March of 2020 when it fell 12.51%. 1

August was one of the year’s best months for the investors as the S&P 500, the Dow Jones Industrial Average (DJIA), and the NASDAQ Composite each hit new all-time highs. It is the seventh straight month of increases for the S&P 500 as it finished the month up 2.90%, and the index is now up 20.41% for the year. 1 Coming in alongside market highs was earnings growth as 98% of companies in the S&P 500 have now reported for the second quarter. Earnings were expected to be higher this year relative to the lower levels caused by the virus in 2020 as estimates for second quarter earnings growth came in at 63%. However, with almost all companies having reported, earnings growth significantly outperformed expectations as it came in at 89% helping the market reach new highs. 2

The S&P 500 continued to climb for the fifth straight month as the index hit a new all-time high on July 29 th . 1 The index finished the month up 2.27% and is now up 17.02% on the year. The Dow Jones Industrial Average (DJIA) and the NASDAQ Composite both increased during the month as well finishing up 1.26% and 1.20% respectively. Both indices are now comfortably in double digit returns for the year. Small cap stocks took a significant hit as the Russell 2000 fell 3.65% during the month, but it is still up 12.73% on the year. As investors move some of their equity gains into fixed income and the Fed continues with their asset purchases, bond demand has increased leading to a return of 1.12% for the U.S. Agg in the month of July. It is now down just 0.50% on the year. 2

The S&P 500 Index continues to climb in June as it finished the month up 2.22% leading to a 14.41% increase on the year. The technology heavy NASDAQ led the way during the second quarter as it was up 9.50% on the quarter following a strong June, and it is now up 12.50% on the year. The Dow Jones Industrial Average (DJIA) did not follow suit during the month of June as it was down 0.08%, but the index is still up nearly 13% on the year. 1

Equities fell on the last trading day of April as investors likely took their share of profits after positive news regarding corporate earnings and economic data. However, the major U.S. indices still finished in positive territory for the third straight month as the S&P 500 has hit 25 record highs thus far in 2021. 1

The markets started off strong in May before running into inflation fears towards the middle of the month. After those fears were somewhat curbed by the Fed, markets rallied to end the month. The S&P 500 index is up nearly 12% on the year after it finished the month of May up 0.55%. This is the fourth positive month in a row for the index after it finished down just over 1% in January. The Dow Jones Industrial Average (DJIA) finished the month up nearly 2% and is now up 12.82% on the year. The technology heavy NASDAQ did not fair as well during the month as it declined 1.53% and is now up 6.68% on the year. Small cap stocks were relatively flat for the month as the Russell 2000 finished up 0.11%. The MSCI EAFE and EM indices both finished in positive territory as well. 1 As we enter the summer months, June has traditionally been a weak month for markets as the DJIA is averaging 0.12% over the last 50 years, and it is down an average of 0.7% over the last 20 years. However, July and August are traditionally good months for the index as it averages an increase of 3% over its 125-year history. 2

After a volatile month, the S&P 500 finished at a record high when the markets closed on March 31 st . The index finished the month up 4.24% and is now up 5.77% on the year. As the economic recovery continues, the Dow Jones Industrial Average led the monthly performance numbers as it finished up 6.62% and is now up 7.76% on the year. The technology heavy NASDAQ finished the month in positive territory, but it continues to lag the other two indices after outperforming both in 2020. The index finished the month up 0.41% and is now up 2.78% on the year. Small cap stocks continued to inch higher as the Russell 2000 ended the month up 0.88% and is now up 12.44% on the year. The MSCI EAFE index is up just under 3% on the year after a positive month, however the MSCI Emerging Markets index fell 1.70% during the month and is now up 1.95% on the year. The Bloomberg Barclay’s U.S. Aggregate Bond index fell 1.25% in March and is now down 3.37% on the year. 1

Equity markets were modestly higher in the month of February after January saw both the S&P 500 and Dow Jones Industrial Average (DJIA) in negative territory.
P:
888.798.2360 F:
913.661.1183
6330 Sprint Pkwy Suite 400, Overland Park, KS 66211
Disclosure: Continuity planning offered through CreativeOne Wealth, LLC and CreativeOne Securities, LLC. CreativeOne Wealth, LLC. advisory services offered through CreativeOne Wealth, LLC, a Registered Investment Adviser. CreativeOne Securities, LLC. Member FINRA/SIPC and an Investment Advisor.
Privacy Policy | ADV Part 2A | Form CRS
© 2023 Creative One Marketing Corporation, CreativeOne Wealth, LLC and CreativeOne Securities, LLC.