Blog Layout
Market Commentary | November 2019
Rob Kellogg, CFA® • Dec 05, 2019
THE MARKET AND ECONOMY
The market continued its run throughout the month of November as the three major indexes all closed at record highs eleven times.
The S&P 500 Total Return Index (S&P TR) reached an all-time high of 3,153.62 leading up to Thanksgiving, while the Dow Jones Industrial Average (DJIA) and the NASDAQ reached their respective highs of 28,164.00 and 8,705.17 on the same day.1
Overall, the S&P TR was up 3.63% on the month and 27.63% year to date.2
The DJIA was up 3.72% for the month and is up 20.25% year to date. The NASDAQ was up 4.50% for the month and is up 20.60% year to date.1 The continuation of the market rally is in large part due to progress on the U.S./China trade talks and the strength of the United States economy.
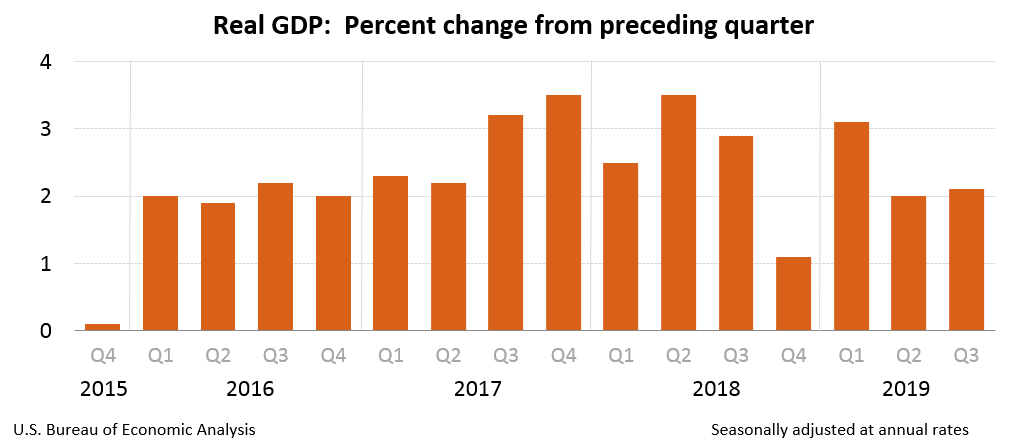
Originally estimated to rise at 1.6% in the third quarter,3
U.S. GDP (real gross domestic product) increased at a 1.9% annualized rate for the quarter according to the “advanced” estimate released in late October.4
However, when more complete information was made available, a “second estimate” was released and the final annualized growth rate for U.S. GDP in the third quarter was 2.1%.5
The 2.1% is actually above the 2% annualized growth rate from the second quarter.3
Real GDP is a country’s total economic output. It is an inflation adjusted statistic that measures the value of goods and services produced by an economy over time. Governments then use these statistics to help measure the overall growth and purchasing power of an economy. We believe this better-than-expected news regarding U.S. GDP has attributed positively to market returns.
Third quarter earnings season for those companies in the S&P 500 winded down in the month of November. As of November 22nd, 96% of the companies in the S&P 500 had reported actual results with 75% of those companies beating earnings estimates and 59% of those companies being revenue estimates. The energy sector delivered the weakest performance while the utilities sector delivered the strongest. The 75% of companies beating estimates is over the 5-year average (granted those estimates have been lowered throughout the year), and the 59% of companies beating revenue estimates is even with the 5-year average. While these numbers are positive news on the surface for investors, the estimated blended earnings of all companies in the S&P 500 index was a decrease of 2.1%, which will be the third straight quarter of year-over-year declines in earnings since late 2015 – early 2016. The estimated blended revenue growth is 3.1% which is below the 5-year average of 3.5%, but still positive. To conclude, more companies are beating earning estimates, but by a smaller margin. At the end of the day, analysts believe we will see a decline in Q4 earnings followed by quite positive earnings in Q1 and Q2 of 2020.6
The Fed
The final Fed policy meeting in 2019 is scheduled for December 10th and 11th.7 The Fed still sees 2% inflation as a sign of sustainable growth, and inflation remains slightly below that level despite recent rate cuts. Based on previous meetings and Fed Chairman Jerome Powell’s recent comments, they are likely to stay put until 2020 unless something noticeably worsens.
CURRENT EVENTS UPDATE
Trade Talks
Recently, United States President, Donald Trump, signed two bills that support the protestors in Hong Kong. The Hong Kong protests initially started against plans allowing citizens to be extradited to mainland China. Hong Kong was a British Colony until 1997 and was then set to be its own separate legal and judiciary system apart from mainland China until 2047. The recent extradition bill may begin to give China too much influence too soon over the city. President Trump supporting the Hong Kong protesters is seen as the United States taking a pro-democracy stance, but China does not agree with the U.S. interfering with these affairs.
Despite President trump supporting Hong Kong, the U.S./China trade talks have continued to progress. The next key date is December 15th. As of now, the U.S. is still set to impose a 15% tariff on $160 billion of Chinese exports into the U.S. Recent reports believe that a “phase one” deal will be completed before the December 15th date.9
Brexit
As we discussed last month, current Prime Minister Boris Johnson and his party pushed for a snap election to occur on December 12th, 2019. In the United Kingdom, they do not elect a Prime Minister directly in the way that the United States elects a president. Instead, they elect a leader of each party, and then the leader of the party that wins the majority of the 650 constituencies in Parliament becomes the Prime Minister. The party needs 326 members in order to become the majority, otherwise, they will need to gain the support of other parties. The three main parties spent most of their time campaigning throughout the month of November. Current poll numbers have Boris Johnson and the Conservatives leading with 43% of the vote, then the Labour Party with 33% of the vote, followed by the Liberal Democrats with 13% of the vote.10
The Conservatives want a Brexit deal, the Labour Party wants to negotiate a softer Brexit deal and then give the public another chance to vote on whether or not to leave the European Union, and the Liberal Democrats want to scrap Brexit altogether. In reality, voters care about more issues than just Brexit, and the rise of other smaller parties makes the possibility of a hung parliament (one without a majority) even higher.11
A lot can happen before December 12th, and so far, it is likely that the Conservatives maintain the most Members of Parliament, but that they still do not gain the 326-person majority needed. Thus, they will need to get the support of smaller parties or the United Kingdom will be in the same spot it has been for the last year.
CONCLUSION
The market continued to increase for most of November with a slight hiccup to start the month of December, but we believe the market has the potential to continue its growth through the end of the year. While equity valuations continue to rise, there is potential for short-term risk if U.S./China trade negotiations fall apart ahead of the December 15th deadline. A balanced asset allocation should allow for growth potential if markets continue to increase but also allow some downside protection should things go awry.
With the end of the year approaching, it is also a good time for us to revisit your financial situation. We’ll need to make sure that we finalize the required minimum distributions (RMD) in your retirement accounts. Discuss the possibility of tax harvesting some of the losses in your investments. And lastly, it is important to revisit your risk tolerance heading into the new year and to discuss any life changes that have occurred or will be occurring in 2020.
Returns are based on the S&P 500 Total Return Index, an unmanaged, capitalization-weighted index that measures the performance of 500 large capitalization domestic stocks representing all major industries. Indices do not include fees or operating expenses and are not available for actual investment. The hypothetical performance calculations are shown for illustrative purposes only and are not meant to be representative of actual results while investing over the time periods shown. The hypothetical performance calculations for the respective strategies are shown gross of fees. If fees were included returns would be lower. Hypothetical performance returns reflect the reinvestment of all dividends. The hypothetical performance results have certain inherent limitations. Unlike an actual performance record, they do not reflect actual trading, liquidity constraints, fees and other costs. Also, since the trades have not actually been executed, the results may have under- or overcompensated for the impact of certain market factors such as lack of liquidity. Simulated trading programs in general are also subject to the fact that they are designed with the benefit of hindsight. Returns will fluctuate and an investment upon redemption may be worth more or less than its original value. Past performance is not indicative of future returns. An individual cannot invest directly in an index.
Advisory Services offered through ChangePath, LLC a Registered Investment Adviser.
Source (5)
"As of November 22nd, 96% of the companies in the S&P 500 had reported actual results with 75% of those companies beating earnings estimates and 59% of those companies being revenue estimates."

Source (8)
"Current poll numbers have Boris Johnson and the Conservatives leading with 43% of the vote, then the Labour Party with 33% of the vote, followed by the Liberal Democrats with 13% of the vote."

November was a dizzying month for investors. The highlight? Earnings. 82% of companies1 beat estimates this quarter, despite headwinds such as supply chain constraints and inflation. The market’s biggest muse? Elon Musk’s twitter handle, with tweets such as (paraphrased) “should I sell 10% of my Tesla stock?” The most exciting job? Fed watcher. We started tapering, saw a plethora of hot inflation data, and gleaned insight from Federal Reserve Chair Jerome Powell on the last day of the month. November 2021 Market Returns

October was another positive month for the markets after September’s pullback. So far in 2021, the S&P 500 had nine positive performing months, September being the only hold out. The index ended up 6.9%, even though the first week of the month started a bit volatile. However, 2021 is looking robust, even if November and December aren’t large contributors, as the YTD performance through October is 23.9%. 1

September ended the streak of seven positive months in a row for the S&P 500 as it was the first negative month for the index since January of this year. The index ended the month down 4.76%, but it is still up nearly 15% on the year. That is the worst monthly decline for the index since March of 2020 when it fell 12.51%. 1

August was one of the year’s best months for the investors as the S&P 500, the Dow Jones Industrial Average (DJIA), and the NASDAQ Composite each hit new all-time highs. It is the seventh straight month of increases for the S&P 500 as it finished the month up 2.90%, and the index is now up 20.41% for the year. 1 Coming in alongside market highs was earnings growth as 98% of companies in the S&P 500 have now reported for the second quarter. Earnings were expected to be higher this year relative to the lower levels caused by the virus in 2020 as estimates for second quarter earnings growth came in at 63%. However, with almost all companies having reported, earnings growth significantly outperformed expectations as it came in at 89% helping the market reach new highs. 2

The S&P 500 continued to climb for the fifth straight month as the index hit a new all-time high on July 29 th . 1 The index finished the month up 2.27% and is now up 17.02% on the year. The Dow Jones Industrial Average (DJIA) and the NASDAQ Composite both increased during the month as well finishing up 1.26% and 1.20% respectively. Both indices are now comfortably in double digit returns for the year. Small cap stocks took a significant hit as the Russell 2000 fell 3.65% during the month, but it is still up 12.73% on the year. As investors move some of their equity gains into fixed income and the Fed continues with their asset purchases, bond demand has increased leading to a return of 1.12% for the U.S. Agg in the month of July. It is now down just 0.50% on the year. 2

The S&P 500 Index continues to climb in June as it finished the month up 2.22% leading to a 14.41% increase on the year. The technology heavy NASDAQ led the way during the second quarter as it was up 9.50% on the quarter following a strong June, and it is now up 12.50% on the year. The Dow Jones Industrial Average (DJIA) did not follow suit during the month of June as it was down 0.08%, but the index is still up nearly 13% on the year. 1

Equities fell on the last trading day of April as investors likely took their share of profits after positive news regarding corporate earnings and economic data. However, the major U.S. indices still finished in positive territory for the third straight month as the S&P 500 has hit 25 record highs thus far in 2021. 1

The markets started off strong in May before running into inflation fears towards the middle of the month. After those fears were somewhat curbed by the Fed, markets rallied to end the month. The S&P 500 index is up nearly 12% on the year after it finished the month of May up 0.55%. This is the fourth positive month in a row for the index after it finished down just over 1% in January. The Dow Jones Industrial Average (DJIA) finished the month up nearly 2% and is now up 12.82% on the year. The technology heavy NASDAQ did not fair as well during the month as it declined 1.53% and is now up 6.68% on the year. Small cap stocks were relatively flat for the month as the Russell 2000 finished up 0.11%. The MSCI EAFE and EM indices both finished in positive territory as well. 1 As we enter the summer months, June has traditionally been a weak month for markets as the DJIA is averaging 0.12% over the last 50 years, and it is down an average of 0.7% over the last 20 years. However, July and August are traditionally good months for the index as it averages an increase of 3% over its 125-year history. 2

After a volatile month, the S&P 500 finished at a record high when the markets closed on March 31 st . The index finished the month up 4.24% and is now up 5.77% on the year. As the economic recovery continues, the Dow Jones Industrial Average led the monthly performance numbers as it finished up 6.62% and is now up 7.76% on the year. The technology heavy NASDAQ finished the month in positive territory, but it continues to lag the other two indices after outperforming both in 2020. The index finished the month up 0.41% and is now up 2.78% on the year. Small cap stocks continued to inch higher as the Russell 2000 ended the month up 0.88% and is now up 12.44% on the year. The MSCI EAFE index is up just under 3% on the year after a positive month, however the MSCI Emerging Markets index fell 1.70% during the month and is now up 1.95% on the year. The Bloomberg Barclay’s U.S. Aggregate Bond index fell 1.25% in March and is now down 3.37% on the year. 1

Equity markets were modestly higher in the month of February after January saw both the S&P 500 and Dow Jones Industrial Average (DJIA) in negative territory.
P:
888.798.2360 F:
913.661.1183
6330 Sprint Pkwy Suite 400, Overland Park, KS 66211
Disclosure: Continuity planning offered through CreativeOne Wealth, LLC and CreativeOne Securities, LLC. CreativeOne Wealth, LLC. advisory services offered through CreativeOne Wealth, LLC, a Registered Investment Adviser. CreativeOne Securities, LLC. Member FINRA/SIPC and an Investment Advisor.
Privacy Policy | ADV Part 2A | Form CRS
© 2023 Creative One Marketing Corporation, CreativeOne Wealth, LLC and CreativeOne Securities, LLC.