Blog Layout
Market Commentary | June 2019
Rob Kellogg, CFA® • Jul 05, 2019
PERFORMANCE RECAP
Market Volatility Returns – but don’t let your emotions lead to bad decisions
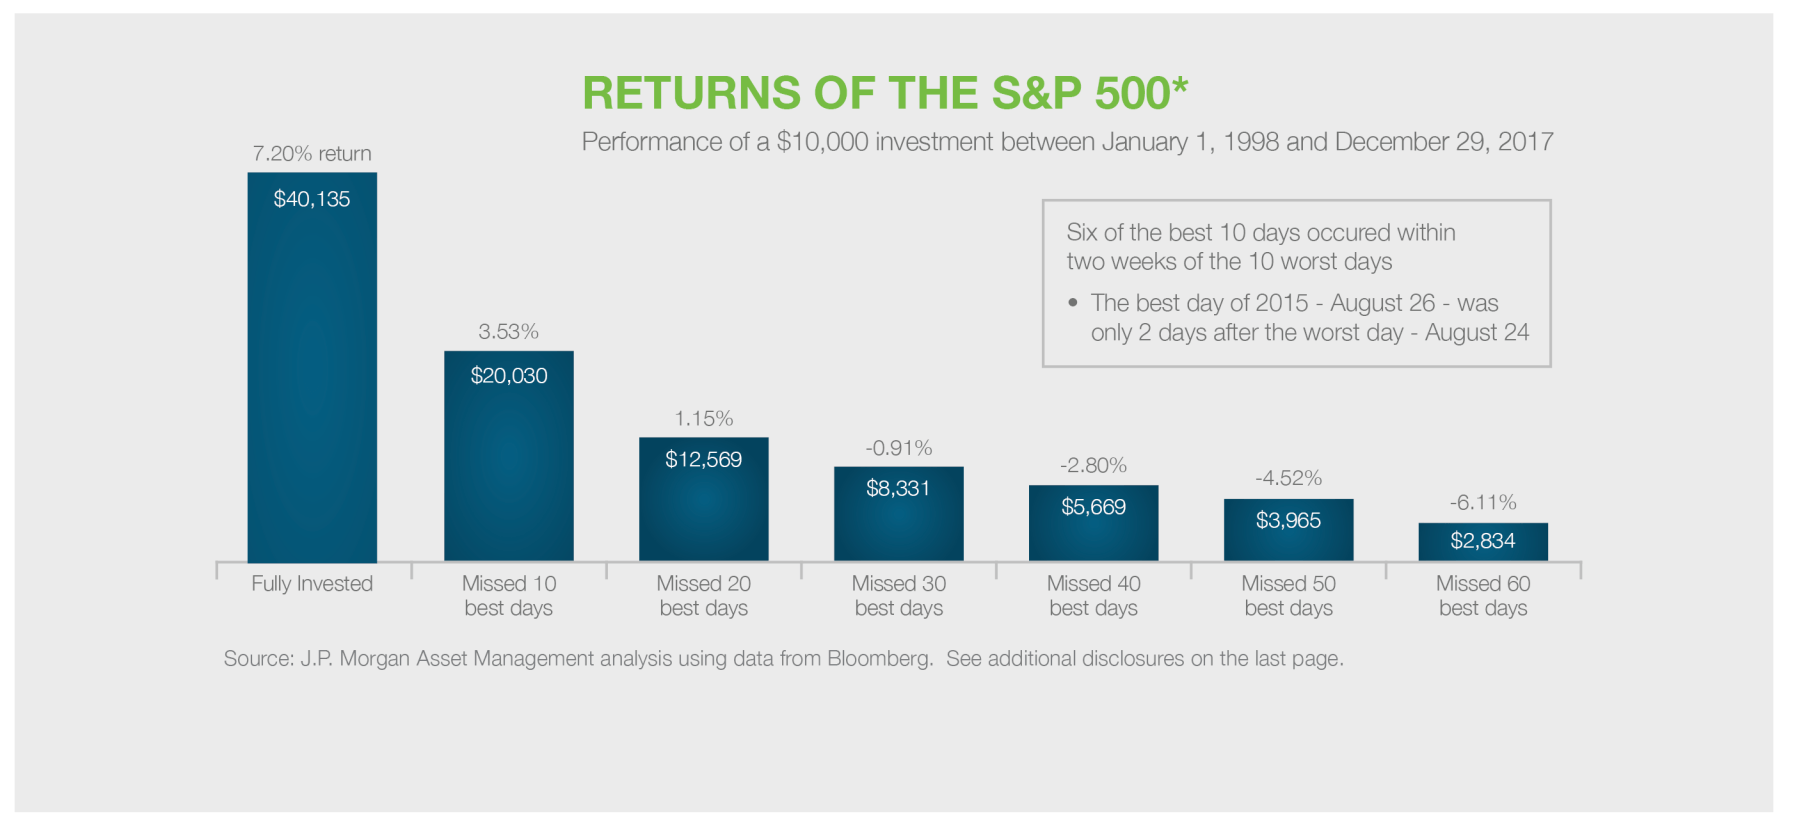
The S&P 500 fell 2.6% during the last trading week of May as economic data remained bleak and threats of tariffs on Mexico over immigration became a real possibility. Overall, the S&P 500 was down over 6.5% during the month of May. This finished off the worst month for the markets since December of 2018 when the S&P 500 was down just over 9%. However, the good news is that some of the best days of the market can sometimes come shortly after some of the worst. The bad news is that if you are lucky enough to miss the worst days, you
will probably also miss the best days. To show evidence of this in recent months, January of 2019 saw the S&P 500 rise 7.87% rebounding after a rough December, and most recently, the S&P 500 finished up 6.89% in June of 2019 after a rough May. June’s performance was the best for the S&P 500 since January of 2019 Similar volatility occurred with both the DJIA 30 and the NASDAQ. The DJIA was down 8.66% in December of 2018 and down 6.69% in May of 2019 but was up 7.17% in January of 2019 and 7.19% in June of 2019. The NASDAQ was down 9.48% in December of 2018 and down 7.93% in May of 2019 but was up 9.74% in January of 2019 and up 7.42% in June of 2019.1 We bring these four months to your attention as many are fearful of the volatility and possible talks of a recession later in 2019 or in 2020. Often the average investor will trade on emotion after these rough performing months and proceed to miss out on the potential upside that follows. While the previously mentioned examples are not always the case, we want to take a longer-term view of the market and emphasize the importance of staying disciplined based on your initial asset allocation. The below chart shows the effect of being out of the market during some of its better performing days. Those days frequently occurred shortly following some of its worst performing days. The chart is shown over a 20-year time frame, but it is still important to remember these concepts on a yearly basis as shown by December of 2018 through June of 2019.
CURRENT EVENTS
The June Fed Meeting
The Federal Reserve (Fed) usually lowers rates to stimulate economic growth. These lower rates encourage borrowing which in turn leads to more investing. In simple terms, and we are sure this will be discussed more in depth in further commentaries, if the Fed sees data points that show a weakening economy, they may potentially cut rates.
During the Fed’s most recent meeting in June, they decided not to reduce their benchmark interest rate. It will remain at 2.35%, with a range of 2.25% to 2.50%.2
A rate cut in the next meeting is not a foregone conclusion either, but there is potential. The Federal Open Market Committee (FOMC) claims the current economic data points do not support a rate cut, but it does expect the economic climate to change in the next few months, possibly for the worse. However, the FOMC wants these uncertainties to become clearer before adjusting policy.3
While it is not specifically stated, it is likely that these uncertainties mean slowing global growth and international trade risks.
Trade Talks
Trade negotiations with China seem to be the biggest concern on everyone’s mind, and we will get to that in a moment. First, we want to remind everyone that there was a short-term tiff with our neighbor to the south. As mentioned earlier, potential tariffs being placed on Mexican goods caused a sharp downturn in the markets to end May. However, as quickly as the tariffs became possible, an agreement was reached, and they were “indefinitely suspended” according to a tweet from President Donald Trump.4
This caused a 4.5% increase for the S&P 500 during the first week in June rebounding off the 2.6% decrease that ended May.1
We mention this to show you the amount of volatility in the market that can be caused by trade talks and how quickly it can reverse. Once again, we emphasize the importance of avoiding emotional investment decisions based on short term volatility.
Negotiations with China have their own set of consequences and for a while, there did not look to be a good solution in sight. However, during the recent G20 summit in Japan on June 28th and 29th, after meeting with Chinese President Xi Jinping, Trump decided to relax limits on Huawei (Chinese telecommunications giant) and delay new tariffs on Chinese goods. The U.S. agreed to hold off on imposing new tariffs on $300 billion in Chinese goods, although existing tariffs on $250 billion of imports remain in place. The reason behind the decision is still up for debate and there are people on both sides of the fence. Regardless of the reasoning, the S&P 500 opened the day up on July 1st as investors purchased some riskier holdings5, but the overall conclusion remains to be seen. The same issues that have plagued negotiators for months are still evident but as of June 29th, negotiations between the world’s two biggest economies will continue as Trump and Xi agreed to restart trade talks.
OUTLOOK
Can the expansion continue?
As of July 1st, 2019, the current economic expansion is ten years and one day old.
It is the longest in United States history, but not necessarily the best. The expansions in the 1960s, 1970s, and 1990s, were all better in terms of total growth and the pace of that growth. They each also had something in common that the current expansion does not. The previous expansions all had to do with major shifts towards more free markets in at least one area of public policy. For example, in the 1980s, the federal government cut income tax rates across the board. However, the current expansion began in June of 2009 despite tax hikes and more regulation.6
In recent years, policy direction has finally shifted pro-growth with large cuts in corporate tax rates and deregulation among other things. The US economy responded well with growth increasing in 2017 and 2018, and 2019 is on track for another year of growth in 2019. With tax rates having been reduced, regulatory policy still heading in a better direction, and monetary policy being less restrictive, we don’t see the growth coming to a slowdown anytime soon.
Flashy news headlines can tempt one to make knee-jerk decisions but sticking to a strategy and maintaining a portfolio consistent with your goals and risk tolerance is imperative for long-term success. Including a broad mixture of asset classes can help with achieving more consistent long-term results, smoothing the short-term market noise and making it easier to weather these common volatility storms.
1 https://www.investing.com/indices
*Returns are based on the S&P 500 Total Return Index, an unmanaged, capitalization-weighted index that measures the performance of 500 large capitalization domestic stocks representing all major industries. Indices do not include fees or operating expenses and are not available for actual investment. The hypothetical performance calculations are shown for illustrative purposes only and are not meant to be representative of actual results while investing over the time periods shown. The hypothetical performance calculations for the respective strategies are shown gross of fees. If fees were included returns would be lower. Hypothetical performance returns reflect the reinvestment of all dividends. The hypothetical performance results have certain inherent limitations. Unlike an actual performance record, they do not reflect actual trading, liquidity constraints, fees and other costs. Also, since the trades have not actually been executed, the results may have under- or overcompensated for the impact of certain market factors such as lack of liquidity. Simulated trading programs in general are also subject to the fact that they are designed with the benefit of hindsight. Returns will fluctuate and an investment upon redemption may be worth more or less than its original value. Past performance is not indicative of future returns. An individual cannot invest directly in an index. Data as of December 29, 2017.
Advisory services offered through ChangePath, LLC a Registered Investment Adviser. Please consult your investment adviser representative for investment advice tailored to your individual circumstances; the material presented herein is of a general nature and for informational purposes only.
"During the Fed’s most recent meeting in June, they decided not to reduce their benchmark interest rate. It will remain at 2.35%, with a range of 2.25% to 2.50%."
"During the recent G20 summit in Japan on June 28th and 29th, after meeting with Chinese President Xi Jinping, Trump decided to relax limits on Huawei (Chinese telecommunications giant) and delay new tariffs on Chinese goods."


November was a dizzying month for investors. The highlight? Earnings. 82% of companies1 beat estimates this quarter, despite headwinds such as supply chain constraints and inflation. The market’s biggest muse? Elon Musk’s twitter handle, with tweets such as (paraphrased) “should I sell 10% of my Tesla stock?” The most exciting job? Fed watcher. We started tapering, saw a plethora of hot inflation data, and gleaned insight from Federal Reserve Chair Jerome Powell on the last day of the month. November 2021 Market Returns

October was another positive month for the markets after September’s pullback. So far in 2021, the S&P 500 had nine positive performing months, September being the only hold out. The index ended up 6.9%, even though the first week of the month started a bit volatile. However, 2021 is looking robust, even if November and December aren’t large contributors, as the YTD performance through October is 23.9%. 1

September ended the streak of seven positive months in a row for the S&P 500 as it was the first negative month for the index since January of this year. The index ended the month down 4.76%, but it is still up nearly 15% on the year. That is the worst monthly decline for the index since March of 2020 when it fell 12.51%. 1

August was one of the year’s best months for the investors as the S&P 500, the Dow Jones Industrial Average (DJIA), and the NASDAQ Composite each hit new all-time highs. It is the seventh straight month of increases for the S&P 500 as it finished the month up 2.90%, and the index is now up 20.41% for the year. 1 Coming in alongside market highs was earnings growth as 98% of companies in the S&P 500 have now reported for the second quarter. Earnings were expected to be higher this year relative to the lower levels caused by the virus in 2020 as estimates for second quarter earnings growth came in at 63%. However, with almost all companies having reported, earnings growth significantly outperformed expectations as it came in at 89% helping the market reach new highs. 2

The S&P 500 continued to climb for the fifth straight month as the index hit a new all-time high on July 29 th . 1 The index finished the month up 2.27% and is now up 17.02% on the year. The Dow Jones Industrial Average (DJIA) and the NASDAQ Composite both increased during the month as well finishing up 1.26% and 1.20% respectively. Both indices are now comfortably in double digit returns for the year. Small cap stocks took a significant hit as the Russell 2000 fell 3.65% during the month, but it is still up 12.73% on the year. As investors move some of their equity gains into fixed income and the Fed continues with their asset purchases, bond demand has increased leading to a return of 1.12% for the U.S. Agg in the month of July. It is now down just 0.50% on the year. 2

The S&P 500 Index continues to climb in June as it finished the month up 2.22% leading to a 14.41% increase on the year. The technology heavy NASDAQ led the way during the second quarter as it was up 9.50% on the quarter following a strong June, and it is now up 12.50% on the year. The Dow Jones Industrial Average (DJIA) did not follow suit during the month of June as it was down 0.08%, but the index is still up nearly 13% on the year. 1

Equities fell on the last trading day of April as investors likely took their share of profits after positive news regarding corporate earnings and economic data. However, the major U.S. indices still finished in positive territory for the third straight month as the S&P 500 has hit 25 record highs thus far in 2021. 1

The markets started off strong in May before running into inflation fears towards the middle of the month. After those fears were somewhat curbed by the Fed, markets rallied to end the month. The S&P 500 index is up nearly 12% on the year after it finished the month of May up 0.55%. This is the fourth positive month in a row for the index after it finished down just over 1% in January. The Dow Jones Industrial Average (DJIA) finished the month up nearly 2% and is now up 12.82% on the year. The technology heavy NASDAQ did not fair as well during the month as it declined 1.53% and is now up 6.68% on the year. Small cap stocks were relatively flat for the month as the Russell 2000 finished up 0.11%. The MSCI EAFE and EM indices both finished in positive territory as well. 1 As we enter the summer months, June has traditionally been a weak month for markets as the DJIA is averaging 0.12% over the last 50 years, and it is down an average of 0.7% over the last 20 years. However, July and August are traditionally good months for the index as it averages an increase of 3% over its 125-year history. 2

After a volatile month, the S&P 500 finished at a record high when the markets closed on March 31 st . The index finished the month up 4.24% and is now up 5.77% on the year. As the economic recovery continues, the Dow Jones Industrial Average led the monthly performance numbers as it finished up 6.62% and is now up 7.76% on the year. The technology heavy NASDAQ finished the month in positive territory, but it continues to lag the other two indices after outperforming both in 2020. The index finished the month up 0.41% and is now up 2.78% on the year. Small cap stocks continued to inch higher as the Russell 2000 ended the month up 0.88% and is now up 12.44% on the year. The MSCI EAFE index is up just under 3% on the year after a positive month, however the MSCI Emerging Markets index fell 1.70% during the month and is now up 1.95% on the year. The Bloomberg Barclay’s U.S. Aggregate Bond index fell 1.25% in March and is now down 3.37% on the year. 1

Equity markets were modestly higher in the month of February after January saw both the S&P 500 and Dow Jones Industrial Average (DJIA) in negative territory.
P:
888.798.2360 F:
913.661.1183
6330 Sprint Pkwy Suite 400, Overland Park, KS 66211
Disclosure: Continuity planning offered through CreativeOne Wealth, LLC and CreativeOne Securities, LLC. CreativeOne Wealth, LLC. advisory services offered through CreativeOne Wealth, LLC, a Registered Investment Adviser. CreativeOne Securities, LLC. Member FINRA/SIPC and an Investment Advisor.
Privacy Policy | ADV Part 2A | Form CRS
© 2023 Creative One Marketing Corporation, CreativeOne Wealth, LLC and CreativeOne Securities, LLC.